Reference no: EM131096664
10-701 Machine Learning - Spring 2012 - Problem Set 4
Q1. Bayesian Networks
1.1 Independence-
In this question we analyze how a probabilistic graphical model encodes probabilistic dependence assumptions. Given the graphical model below, which of the following statements are true, regardless of the conditional probability distributions?
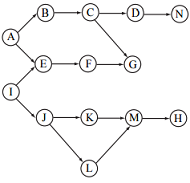
(a) P(D, H) = P(D)P(H)
(b) P(A, I) = P(A)P(I)
(c) P(A, I|G) = P(A|G)P(I|G)
(d) P(J, G|F) = P(J|F)P(G|F)
(e) P(J, M|K, L) = P(J|K, L)P(M|K, L)
(f) P(E, C|A, G) = P(E|A, G)P(C|A, G)
(g) P(E, C|A) = P(E|A)P(C|A)
1.2 Constructing a Network-
Consider three binary variables x, y, and z with the following joint distribution:
|
x
|
y
|
z
|
p(x, y, z)
|
|
0
|
0
|
0
|
0.135
|
|
0
|
0
|
1
|
0.09
|
|
0
|
1
|
0
|
0.005
|
|
0
|
1
|
1
|
0.02
|
|
1
|
0
|
0
|
0.1125
|
|
1
|
0
|
1
|
0.075
|
|
1
|
1
|
0
|
0.1125
|
|
1
|
1
|
1
|
0.45
|
Show that the joint distribution p(x, y, z) can be represented by a Bayes net that has just two edges.
1.3 Variable Elimination-
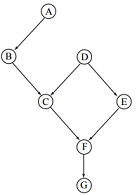
In this question we are going to practice variable elimination on the Bayesian network given above. All of the variables are binary valued {T, F}. The conditional probabilities are:
P(A = T) = 0.7 P(D = T) = 0.6
P(B = T|A = T) = 0.9, P(B = T|A = F) = 0.3
P(C = T|D = T, B = T) = 0.9, P(C = T|D = T, B = F) = 0.5
P(C = T|D = F, B = T) = 0.7, P(C = T|D = F, B = F) = 0.2
P(E = T|D = T) = 0.1, P(E = T|D = F) = 0.4
P(F = T|E = T, C = T) = 0.2, P(F = T|E = T, C = F) = 0.1
P(F = T|E = F, C = T) = 0.9, P(F = T|E = F, C = F) = 0.2
P(G = T|F = T) = 0.5, P(G = T|F = F) = 0.1
(a) Joint Probability- Write down the formula for the joint probability distribution that makes the same conditional independent assumptions as the above graph.
(b) Variable Elimination- Using variable elimination, compute the probability P(G = T|A = T) =?. Show your work.
(c) Variable Elimination [10 points] Using variable elimination, compute the probability P(G = T|A = T, D = T) =?. Show your work.
1.4 Admissible Bayesian Networks-
Provide an upper and lower bound on the number of possible Bayesian Networks with n nodes and explain them. Be as tight as possible (remember that a Bayesian Network is a Directed Acyclic Graph).
Q2. Semi-supervised Learning
We begin by looking at the problem of Bernoulli Naive Bayes classification with one binary class variable Y and 3 binary feature variables X1, X2, X3. For the Naive Bayes classifier, we would like to learn the best choice of parameters for P(Y ), P(X1| Y), P(X2| Y), and P(X3 |Y). Assume Y, X1|Y, X2| Y, and X3|Y are all Bernoulli variables and let us denote the Bernoulli parameters as
θY = y = P(Y = y), θX1 = x1|Y =y = P(X1 = x1|Y = y),
θX2=x2|Y =y = P(X2 = x2|Y = y), θX3 = x3|Y =y = P(X3 = x3|Y = y).
(a) Write the log-probability of X and Y in terms of the parameters θ first for a single example (X1 = x1, X2 = x2, X3 = x3, Y = y), then for n i.i.d. examples (Xi1 = xi1, Xi2 = xi2, Xi3 = xi3, Yi = yi) for i = 1, ..., n.
(b) Next derive the maximum likelihood estimate of the parameters θY = arg maxθ i=1∑n∑j log P(Yji| θ) and θxj=xj|Y =1 = arg maxθ i=1∑n∑jlog P(Xij|Yi, θ).
Next, consider the case where the class value Y is never directly observed but it is approximately observed using a sensor. Let Z be the binary variable representing the sensor values. One morning you realize the sensor value is missing in some of the examples. From the sensor specifications, you learn that the probability of missing values is four times higher when Y = 1 than when Y = 0. More specifically, the exact values from the sensor specifications are:
P(Z missing|Y = 1) = .08, P(Z = 1|Y = 1) = .92
P(Z missing|Y = 0) = .02, P(Z = 0|Y = 0) = .98
(c) Draw a Bayes net that represents this problem with a node Y that is the unobserved label, a node Z that is either a copy of Y or has the value "missing", and the three features X1, X2, X3.
(d) What is the probability of the unobserved class label being 1 given no other information, i.e., P(Y = 1|Z = "missing")? Derive the quantity using the Bayes rule and write your final answer in terms of θY =1, our estimate of P(Y = 1).
(e) Write the log-probability of X, Y and Z given θ, in terms of θ and P(Z|Y ), first for a single example (X1 = x1, X2 = x2, X3 = x3, Z = z, Y = y), then for n i.i.d. examples (Xi1 = xi1, Xi2 = xi2, Xi3 = xi3, Zi = zi, Yi = yi) for i = 1, ..., n.
(f) Provide the E-step and M-step for performing expectation maximization of θ for this problem.
In the E-step, compute the distribution Qt+1(Y |Z, X) using Qt+1(Y = 1|Z, X) = E[Y |Z, X1, X2, X3, θt] using your Bayes net from part (d) and conditional probability from part (e) for the unobserved class label Y of a single example.
In the M-step, compute
θt+1 = argmaxθ i=1∑n∑yQ(Yi = y|Zi, Xi) log P(Xi1, Xi2, Xi3, Yi, Zi|θ)
using all of the examples (X11, X12, X13, Y1, Z1), ...,(Xn1, Xn2, Xn3, Yn, Zn). Note: it is OK to leave your answers in terms of Q(Y |Z, X).
Q3. K-means and GMMs
3.1 K-Means-
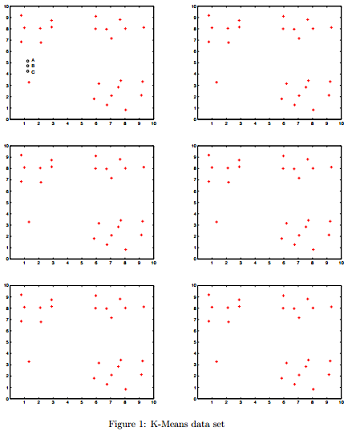
Consider the data set in Figure 1. The '+' symbols indicate data points and the (centers of the) circles A, B, and C indicate the starting cluster centers. Show the results of running the K-means algorithm on this data set. To do this, use the remaining figures, and for each iteration, indicate which data points will be associated with each of the clusters, and show the locations of the updated class centers. If a cluster center has no points associated with it during the cluster update step, it will not move. Use as many figures as you need until the algorithm converges.
3.2 Gaussian Mixture Models-
In this problem we will be implementing Gaussian mixture models and working with the digits data set. The provided data set is a Matlab file consisting of 5000 10×10 pixel hand written digits between 0 and 9. Each digit is a grayscale image represented as a 100 dimensional row vector (the images have been down sampled from the original 28 × 28 pixel images. The variable X is a 5000 × 100 matrix and the vector Y contains the true number for each image. Please submit your code and include in your write-up a copy of the plots that you generated for this problem.
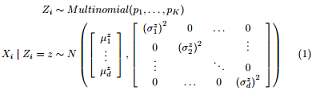
(a) Implementation [10 points] Implement Expectation Maximization (EM) for the axis aligned Gaussian mixture model. Recall that the axis aligned Gaussian mixture model uses the Gaussian Naive Bayes assumption that, given the class, all features are conditionally independent Gaussians. The specific form of the model is given in Equation 1.
Remember, code should be written and turned in individually.
(b) Run EM to fit a Gaussian mixture model with 16 Gaussians on the digits data. Plot each of the means using subplot(4, 4, i) to save paper.
(c) Evaluating Performance Evaluating clustering performance is difficult. However, because we have information about the ground truth data, we can roughly assess clustering performance. One possible metric is to label each cluster with the majority label for that cluster using the ground truth data. Then, for each point we predict the cluster label and measure the mean 0/1 loss. For the digits data set, report your loss for settings k = 1, 10 and 16.
Data File - https://www.cs.cmu.edu/~10701/hw/digits_small.mat.