Reference no: EM132359324 , Length: 10 Pages
Digital Signal Processing Assignment - Study of Decimation and Interpolation Techniques
Unit Learning Outcomes covered in this assessment -
a. Development and implementation of signal processing algorithms in Matlab or Scilab.
b. In-depth design of digital filters.
c. Understand the design of multirate signal processing and their applications.
Introduction - The objective of this assessment is to practice signal processing theoretical concepts by numerical evaluation and software coding in MATLAB (or Octave). Students must individually attempt each part to understand their strengths and weaknesses during the lectures. All the plots must have the title of each student's MIT ID.
Part A: System Analysis
1) Using the z-transform (ROC), prove that the system with h(n) = anu(n), |a| < 1 is BIBO stable?
2) For the system of section 1) prove that the system is time invariant.
3) Is the system of section 1) memoryless? Why?
4) Find the z-transform of a finite length sequence
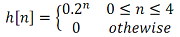
Plot its ROC and discuss its stability?
Part B: Analyzing a system in Z and time domain
A causal system is given by the following transfer function:
H(z) = (1 - 0.2z-1)/((1 - 0.5z-1)(1 - 0.3z-1)) + 2/(1 - 2z-1) (1)
1) Assume the system is causal. Draw its region of convergence (ROC) in the z-plane.
2) Is the system stable or unstable? Why?
3) Determine the system difference equation in the form of
k=1∑Naky[n-k] = k=0∑Mbkx[n-k] (2)
4) Give the values for ai and bj, N and M.
5) Sketch the magnitude frequency response of the system between 0 and π.
6) Suppose the above transfer function is a filter, what type of filter is it? (a low-pass, high-pass, band-pass, band-stop or all-pass).
7) Find the system impulse response (use partial fraction decomposition of the equation (1)).
8) Assume the initial condition is zero, enter a unit impulse to the system and find the impulse response of the system, h[n], for the first 10 samples and compare it with the previous section.
9) Write a MATLAB program to find the impulse response of the following system using polynomial divisions and the partial fraction decompositions (Use slide 28 of the lecture note and Lab 4).
H(z) = (z + 1.2 - 1.15z-1 + 0.85z-2 - 0.8z-3 - 0.15z-4)/(1 - 0.8z-1 - 0.15z-2)
Part C: image decimation Using MATLAB
In this section, you will see the effect of downsampling on a picture. Run the Code in Table 1 (attached).
In the title, section enter your MIT ID.
Change the vertical and horizontal decimation rates a combination of drv=2 or 4 and drh=2 or 4 and plot all the pictures separately and explain the effect of downsampling on the higher frequency section of the images. The higher frequency sections are the sections with close parallel lines.
Part D: Signal decimation and interpolation in MATLAB
1. Load the signal "x" into your workspace by using the command "load original_signal.mat". "x" has 200000 samples with a sampling frequency of 24 Mega samples per second taken from a modulated baseband signal.
2. Plot the first 2000 samples of this signal.
3. Decimate the signal by 3 times using the command "y=x(1:3:end);"
4. Find the power spectrum of "x" and "y" using the MATLAB periodogram and draw them in dB on one axis. Set the FFT size 512. Discuss the similarities and differences of the spectrums.
5. Zero pad (up-sample) the "y" signal sample with 2 zeros in the middle of adjacent samples to increase the sampling frequency by 3 times. And call the resultant signal "zy".
6. Load a root raised cosine filter impulse response, h, from the given file "rrc_filter.mat" into your workspace using the command "load rrc_filter.mat;"
7. Filter your signal ("zy") using the command "yzf=conv(x,h);".
8. Find the power spectrum of "yzx" and "yz" in dB and draw them on one axis.
9. Discuss the zero-padding and filtering effects on the signal spectrum.
10. Use the cubic spline interpolation in MATLAB to interpolate the signal "y" with an up sampling rate of 3 to find "ys".
11. Draw the spectrum of "ys" and compare it with the result of section 8.
12. Repeat section 10 and 11 by changing the method to 'linear' and 'nearest'.
13. Filter the signals "ys" in section 12 with the given filter and find and draw the spectrum and discuss the result.
14. Give an overview of the work you have done and discuss the strength and weakness of each used interpolation methods in Part B.
Part E: System Eigen function and Eigen Value
The impulse response of a moving average system is h(n) = [1 1 1 1]
1) Find H(ejω), the Fourier transform of the system and plot is from 0 ≤ ω ≤ π in steps of 0.1π in MATLAB.
2) Find the response of the system to the input signal R(n) = ej0.2πn.
3) Use MATLAB to generate a complex sequence of signal R for 0 ≤ n ≤ 100.
4) Find the system response to the input R using convolution.
5) Check whether the amplitude of the system corresponds with the theoretical output you found in 2)
6) Measure the frequency of the real part of the output and see whether it has changed?
Attachment:- Digital Signal Processing Assignment File.rar