Reference no: EM13999266
Detailed Question: I need research study prepared. I need a hypothesis, statistical method used with formula and table/figures and results
I can do lit review, write it up and discuss. I am sending the SPSS data file with necessary information.
Instructions for the Research
Report Assignment
Write a brief research report (up to about 7 pages, not including title page, abstract, and references), based on an analysis of the data file. Choose an hypothesis, cite at least three references to justify your hypothesis, test your hypothesis with an analysis of the data, and then report and discuss the results.
Use APA format, including an introduction, abstract, method, results, and discussion section. An outline of this format can be found at:
https://www.uwsp.edu/PSYCH/apa4b.htm
Here are the steps you would go through to write your report.
1) Look over the file variables and come up with a tentative question that could be answered by analyzing those variables. Search the literature (scholar.google.com and the school's data base subscriptions are easy ways to do this) for support of your question. Look for support of similar questions, and then use this as an argument for your hypothesis. If you can't find literature that supports your hypothesis, try another hypothesis.
2) EXAMPLE: I think that there might be a relationship between lifestyle expectations and relationship happiness. In other words, perhaps relationship discord is caused by having unrealistic expectations of an extravagant lifestyle.
Searching the literature, I find this article:
R. A. Easterlin. (2001). Income and happiness: Toward a unified theory. The Economic Journal. 465-483.
which suggests that high material expectations reduce happiness. This supports my hypothesis. My contribution will be to see whether high material expectations also affect relationship satisfaction.
Hypothesis: A desire for a more lavish lifestyle is associated with reduced relationship happiness.
3) In my Method section, I'll describe the demographic characteristics of my sample and how the data were collected.
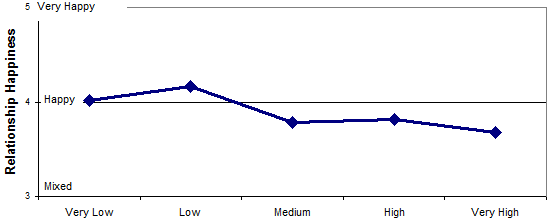
4) In the Results section, I'll describe the results of my SPSS analysis. The correlation between relationship happiness (HAPPY) and lifestyle (L) is: r = -.143, df =398, p < .001.
5) I might want expand on this result. I could see if the correlation was different for males vs. females or for married vs. unmarried participants. I could also add a figure or table to clarify the results.
6) In the discussion section, I would say whether my hypothesis was confirmed. In this case it was; if it were not, I could explain why I thought it wasn't. I would go on to speculate about the implications of my findings, and to suggest future research.
Aim for simplicity and clarity. A research report is only useful if your readers understand it.
Attachment:- statistics-data.rar
|
The main determinant of elasticity of supply is the:
: The main determinant of elasticity of supply is the: Based on the concept of price discrimination, which of the following is NOT likely to occur?
|
|
Tristar production company began operations on septembe
: On September 1, Tristar signed a $40,000 non interest-bearing note to purchase equipment. The $40,000 payment is due on September 1, 2012. Assume that 8% is a reasonable interest rate.
|
|
What is the current yield on the bond
: Perpetual Life Corp. has issued consol bonds with coupon payments of $60. (Consols pay interest forever and never mature. They are perpetuities.) If the required rate of return on these bonds at the time they were issued was 6%, at what price were..
|
|
How far away is the object that reflected the wave
: A radar pulse returns to the receiver after a total travel time of 6.00 x 10⁻⁴ s. How far away is the object that reflected the wave?
|
|
Write a brief research report based on an analysis
: Write a brief research report based on an analysis of the data file - describe the demographic characteristics of my sample and how the data were collected
|
|
Paper in which you discuss asset-liability management
: For this assignment, you will choose a Fortune 500 company and write a three to four page research paper in which you discuss asset-liability management (ALM)
|
|
What is maximum value of electric field associated with wave
: If the radiation from the sun reaching ablove atmosphere of earth is at the rate of 1350 W/m^2, what is the maximum value of the electric field associated with this wave?
|
|
What is net force f vector on particle due solely to charge
: What is the net force F→ on particle 0 due solely to this charge? Express your answer (a vector) using k, q0, q3, d2, i, j, and k. Include only the force caused by particle 3.
|
|
Which of the points do you think are most important
: Which of the points do you think are most important, and why? If management were to implement one of Deming's points each year, do you believe that this methodology would be effective? Why or why not
|