Reference no: EM131718479

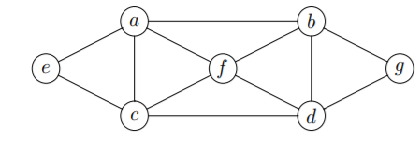
A company named ‘Macquarie Graphic Signs’ produces automated displays for which coloured lights are mounted at locations on a lattice-like frame, built from metal rods, as diagrammed below. A bulb of each colour is mounted where 2 or more rods join, allowing a rigid support to be attached. Under computer control, the coloured lights at each join a, b, . . . , g are switched on or off, but always such that exactly one colour is lit at any time, and the colour at the ends of each rod must be different. Every few seconds the pattern of colours changes across the whole display. a b c d e f g One version of the display has 3 coloured lights at each join, of which exactly one is lit at any time. A more expensive version has 4 different colours at each join, of which exactly one is lit. The controller needs to be programmed to switch between different configurations of the lights, always avoiding having the same colour at opposite ends of a rod.
(a) Explain why graph colouring, and the chromatic polynomial concept, is pertinent to this situation by allowing the number of different configurations to be calculated.
(b) How many different configurations need to be programmed, with 3 colours for the lights?
(c) How many different configurations need to be programmed, with 4 colours for the lights?
(d) Describe the essentially different patterns in the colourings, both using 3 colours and using 4 colours. That is, consider the patterns in the location of colours, rather than the actual colours themselves. Hint: consider how many colours are actually used within the cycle involving the set of vertices {a, b, d, c}.