Reference no: EM13801517
PART A. PLATE BOUNDARIES
QUESTIONS:
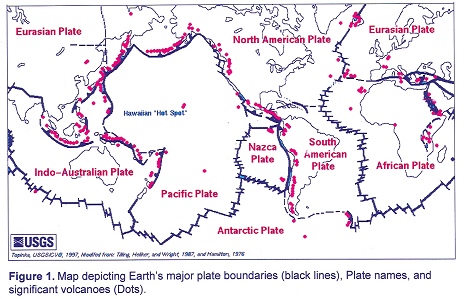
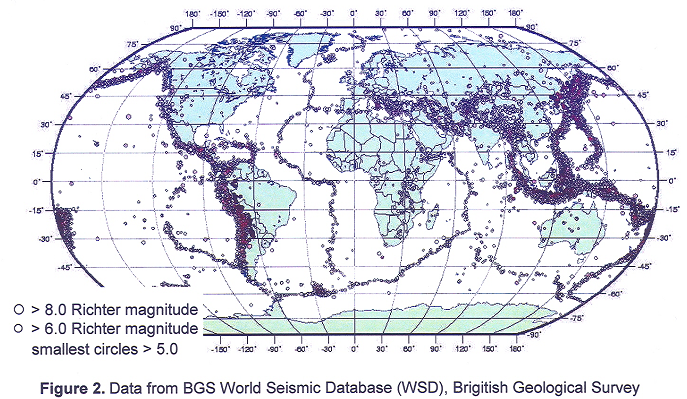
1. Using the Figures 1 and 2 state weather the following plate boundaries are Divergent, Convergent, or Transform.
a) South American Plate and the Nazca Plate _______________
b) Pacific Plate and the Indo-Australian Plate _______________
c) North American Plate and the Eurasian Plate _______________
d) Pacific Plate and the North American Plate in Alaska _______________
e) Indo-Australian Plate and the Eurasian Plate _______________
f) Nazca Plate and the Pacific Plate _______________
g) Pacific Plate and the Eurasian Plate _______________
h) Pacific Plate and the North American Plate in California _____________
i) South American Plate and the African Plate _______________

2. Draw small arrows on Figure 1 showing the sense of motion either sides on the plate boundaries identified above.

PART B. SEAFLOOR SPREADING
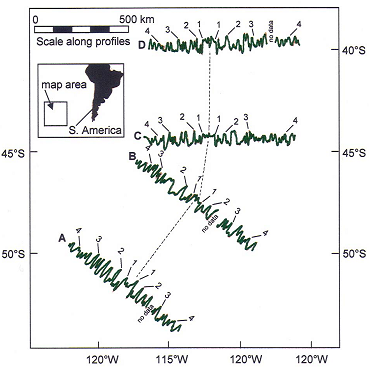
1. Draw lines on both sides of the ridge in Figure 4 that connect labeled magnetic peaks (i.e. draw a line from peak 1 on transect A to peak 1 on transect B to peak 1 on transect C to peak one on transect D and so on for peaks 1 through 4). These lines simulate seafloor striping.

2. Using arrows, indicate on Figure 4 the direction that the plates are moving on each side of the mid-ocean ridge.
3. Explain how the lines you just drew support the idea of seafloor spreading.
4. Scientists have determined that peak 4 is 7.0 million years old. The center of the ridge is 0 years old. Using transect D, calculate the spreading rate (rate at which the sea floor is spreading). Give your answers in km/ million years, and the equivalent rate in cm/year. Be sure to show all of your work. (Hint: calculate the spreading rate on each side of the ridge to get the two half- spreading rates and then add them together to get the full-spreading rate.)
TRANSFORM FAULTS
EXPLANATION:
Figure 1 shows a geologic map along part of the San Andreas Fault, a transform fault that is the boundary of the North American and Pacific plates. At this location, the two plates are sliding past each other. Wallace Creek flows to the northwest from the Tremblor Mountains across the fault. Figure 1 shows the distribution of younger (3680 years to today) and older (10,000 to 3680 years) sediments deposited by the creek. These ages were derived from carbon-14 dating.
QUESTIONS:
1. Why does the present day stream valley bend sharply at the San Andreas Fault?
2. What evidence is there on the map for vertical (up and down) movement along the fault?
3. What do you predict will happen to the course of the creek in the future? Draw on the map if it helps.
4. Draw arrows on Figure 4 to show the direction of movement of the plates on either side of the fault.
5. What is the rate of movement along the fault in the past 10,000 years? This can be determined by dividing the distance of the stream offset across the fault by the age of the oldest sediments in each of the channels. Calculate the offset rate based on data for each channel. Use 10,000 yrs for the age of the sediment in the old channel, and 3,680 yrs for the age of the sediment in the younger channel. Give your answers in cm/yr.