Reference no: EM131678972
Assignment
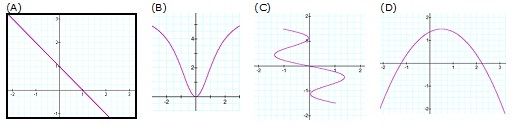
1. Which of these graphs represent a one-to-one function? Answer(s): ____________
(no explanation required.) (There may be more than one graph that qualifies.)
2. Based on data about the growth of a variety of ornamental cherry trees, the following logarithmic model about these trees was determined:
h(t) = 6.108 ln(t) + 6.099, wheret = age of tree in years and h (t) = height of tree, in feet.
(Note that "ln" refers to the natural log function) (explanation optional)
Using the model,
(a) At age 3 years, how tall is this type of ornamental cherry tree, to the nearest tenth of a foot?
(b) At age 12 years, how tall is this type of ornamental cherry tree, to the nearest tenth of a foot?
3. Convert to a logarithmic equation: 7x = 343.(no explanation required) 2. ______
A. log_7?343=x
B. log_x?343=7
C. log_x?7=343
D. log_7?x=343
4. Solve the equation. Check all proposed solutions. Show work in solving and in checking, and state your final conclusion.
√(x-1)=3-x
5.
(a) log_6?1=_______ (fill in the blank)
(b) Let x=log_6?1/216 State the exponential form of the equation.
(c) Determine the numerical value of log_6?1/216, in simplest form. Work optional.
6. Let f(x) = 2x2 -x - 9 and g(x) = 4x+ 1
(a) Findthe composite function (f o g)(x) and simplify the results. Show work.
(b) Find (f o g)(-1). Show work.
7. Let f(x)=(5x - 9)/(3x - 7)
(a) Find f-1, the inverse function of f. Show work.
(b) What is the domain of f? What is the domain of the inverse function?
(c) What is f-1( ____ ), where the number in the blank is your answer from part (c)? work/explanationoptional
8. Let f(x) =ex-1+ 4.
Answers can be stated without additional work/explanation.
(a) Which describes how the graph of f can be obtained from the graph of y = ex ? Choice: ________
A. Shift the graph of y = ex to the left by 1 unit and up by 4 units.
B. Shift the graph of y = ex to the right by 1 unit and up by 4 units.
C. Reflect the graph of y = ex across the x-axis and shift up by 4 units.
D. Reflect the graph of y = ex across the y-axis and shift up by 4 units.
(b) What is the domain of f?
(c) What is the range of f?
(d) What is the horizontal asymptote?
(e) What is the y-intercept? State the approximation to 2 decimal places (i.e., the nearest hundredth).
(f) Which is the graph of f?

NONLINEAR MODELS - For the latter part of the quiz, we will explore some nonlinear models.
9. QUADRATIC REGRESSION
Data: On a particular summer day, the outdoor temperature was recorded at 8 times of the day, and the following table was compiled. A scatterplot was produced and the parabola of best fit was determined.
|
t = Time of day (hour)
|
y = Outdoor
Temperature (degrees F.)
|
|
7
|
52
|
|
9
|
67
|
|
11
|
73
|
|
13
|
76
|
|
14
|
78
|
|
17
|
79
|
|
20
|
76
|
|
23
|
61
|

Quadratic Polynomial of Best Fit:
y = -0.3476t2+ 10.948t-6.0778 wheret = Time of day (hour) and y = Temperature (in degrees)
REMARKS: The times are the hours since midnight. For instance, 7 means 7 am, and 13 means 1 pm.
(a) Using algebraic techniques we have learned, find themaximum temperaturepredicted by the quadratic model and find thetime when it occurred. Report the time to the nearest quarter hour (i.e., __:00 or __:15 or __:30 or __:45). (For instance, a time of 18.25 hours is reported as 6:15 pm.) Report the maximum temperature to the nearest tenth of a degree. Show algebraic work.
(b) Use the quadratic polynomial to estimate the outdoor temperature at 7:30 am, to the nearest tenth of a degree.(work optional)
(c)Use the quadratic polynomial y = -0.3476t2+ 10.948t-6.0778together with algebra toestimate the time(s) of day when the outdoor temperature ywas 72 degrees.
That is, solve the quadratic equation72 = -0.3476t2+ 10.948t-6.0778.
Show algebraic work in solving.State your results clearly; report the time(s) to the nearest quarter hour.
10. +(extra credit at the end) EXPONENTIAL REGRESSION
Data:A cup of hot coffee was placed in a room maintained at a constant temperature of 69 degrees, and the coffee temperature was recorded periodically, in Table 1.
TABLE 1 REMARKS:
|
t = Time Elapsed (minutes)
|
C = Coffee Temperature (degrees F.)
|
|
0
|
166.0
|
|
10
|
140.5
|
|
20
|
125.2
|
|
30
|
110.3
|
|
40
|
104.5
|
|
50
|
98.4
|
|
60
|
93.9
|
Common sense tells us that the coffee will be cooling off and its temperature will decrease and approach the ambient temperature of the room, 69 degrees.
So, the temperature difference between the coffee temperature and the room temperature will decrease to 0.
We will fit the temperature difference data (Table 2) to an exponential curve of the form y = A e-bt.
Notice that as t gets large, y will get closer and closer to 0, which is what the temperature difference will do.
So, we want to analyze the data where t = time elapsed and y = C - 69, the temperature difference between the coffee temperature and the room temperature.
TABLE 2
|
t = Time Elapsed (minutes)
|
y= C- 69 Temperature Difference (degrees F.)
|
|
0
|
97.0
|
|
10
|
71.5
|
|
20
|
56.2
|
|
30
|
41.3
|
|
40
|
35.5
|
|
50
|
29.4
|
|
60
|
24.9
|
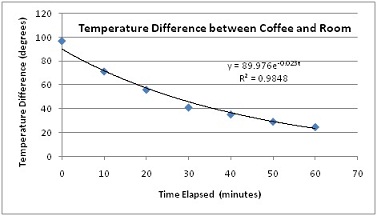
Exponential Function of Best Fit (using the data in Table 2):
y = 89.976 e - 0.023t where t = Time Elapsed (minutes) and y = TemperatureDifference (in degrees)
(a) Use the exponential function to estimate the temperature difference ywhen 25 minutes have elapsed. Report your estimated temperature difference to the nearest tenth of a degree.(explanation/work optional)
(b) Since y = C - 69, we have coffee temperature C = y + 69. Take your difference estimate from part (a) and add 69 degrees. Interpret the result by filling in the blank:
When 25 minutes have elapsed, the estimated coffee temperature is ________ degrees.
(c)Suppose the coffee temperature C is 100 degrees.Theny = C - 69 = ____ degrees is the temperature difference between the coffee and room temperatures.
(d) Consider the equation _____ = 89.976 e - 0.023t where the ____ is filled in with your answer from part (c).
Show algebraic work to solve this part (d) equation for t, to the nearest tenth. Interpret your results clearly in the context of the coffee application. [Use additional paper if needed]