Whether the number of student enrolments at remote schools

Assignment Help Basic Statistics
Reference no: EM131067168

STAT170 ASSIGNMENT-

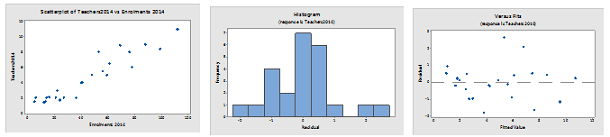
Question 1- A researcher decided to investigate the relationship between student enrolment numbers and teaching staff in remote schools. The following Minitab output was obtained using information recorded on student enrolment numbers and teaching staff in 2014 at 25 very remote schools in Australia. Use this to answer parts a. and b.

2144_figure.png

a. Comment on the validity of each the three assumptions for linear model by referring to each of the plots above:

b. The largest residual was for Goodooga Central School which had the equivalent of 9.4 teaching staff in 2014 and 35 enrolments in 2014. Use this information, and the Fitted Line Plot above, to calculate the residual for Goodooga Central School and explain clearly what is unusual about Goodooga Central School.

The following output was obtained using information on 24 of the very remote schools, (excluding Goodooga Central), from 2014. Use this information to answer part c.

292_Figure1.png

Regression Analysis: Teachers 2014 versus Enrolments 2014

Model Summary

      S                    R-sq                       R-sq(adj)             R-sq(pred)

1.04378                 88.27%                  87.73%               86.39%

Coefficients

Term                                Coef                    SE Coef                 T-Value                P-Value  

Constant                           0.504                   0.383                     1.31                    0.203

Enrolments    2014           0.09146                 0.00711                 ******                ******

c. Why do you think that Goodooga Central school was excluded from this analysis?

d. Use an appropriate hypothesis test to determine whether the number of student enrolments at very remote schools in 2014 was a useful predictor of the number of teaching staff:

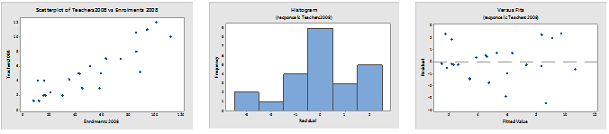
A previous study of the 24 schools from parts c. and d. had been conducted in 2008. The following output was obtained using some of the information recorded on these 24 schools in 2008. Use this output, together with your answers to parts c. and d. to answer the remainder of this question.

431_Figure2.png

Regression Analysis: Teachers 2008 versus Enrolments 2008

Model Summary

      S                     R-sq                      R-sq(adj)             R-sq(pred)

1.52778                 78.59%                  77.61%                  73.91%

Coefficients

Term                                    Coef                      SE Coef                 T-Value                P-Value  

Constant                              0.764                     0.577                     1.32                        0.199

Enrolments     2008              0.08825                 0.00982                   8.99                        0.000 

d. In 2008, did the school with the highest number of student enrolments also have the highest number of teachers?

e. How many students (approximately) were enrolled at the school with the highest number of teachers in 2008?

f. Explain why the model for predicting teaching staff in 2014 will give more reliable predictions than the model for predicting teaching staff in 2008.

g. Make the following predictions, if possible. If not, explain why your predictions would not be valid.

i. Predict the number of teachers in 2008 at a very remote Australian school which had 50 students enrolled.

ii. Predict the number of teachers in 2014 at a very remote Australian school which had 50 students enrolled.

iii. Predict the number of teachers in 2014 at a very remote Australian school which had 150 students enrolled.

Question 2- An educational researcher carried out a study into standardised examinations for high school students. 150 Year 7 students were randomly selected from schools across Australia in 2011 and various information was recorded on these students over a four year period. Some of the variables recorded were:

Variable                                          Description

ID                                                  Student ID

School_Type                                   School type attended by student:           

                                                     1 = Government 

                                                     2 = Catholic         3 = Independent 

School_Enrolment                           School enrolment of school attended by student:

                                                     1 = Co-educational,         2 = Girls,               3 = Boys

Maths_Year7                                  Student's mark on a standardised Mathematics exam in Year 7

Maths_Year11                                 Student's mark on a standardised Mathematics exam in Year 11

English_Year7                                 Student's mark on a standardised English exam in Year 7

English_Year11                               Student's mark on a standardised English exam in Year 11

The data are stored in the Excel file: ExamMarks.xlsx which is on iLearn. Use this data file to complete Question 2.

Each part of this question must be labelled and must be presented in order and must be neatly word processed. Untidy work will not be marked. Each part (a., b. and c.) should be answered by a different student from your group. Each part of this question uses a different section of the data set which should be extracted (either by sorting the data or splitting the worksheet). Each part asks about the difference between average marks for a particular group of students. Since the worksheet contains data on both English and Mathematics marks, each part should address both English and Mathematics marks (ie. one hypothesis test on English marks and one hypothesis on Mathematics marks for each part). Minitab output for these analyses, along with any other appropriate graphical output, should be cut and pasted neatly into the space provided for each part.  Please note that output that is not clearly labelled will not receive any marks (eg. Group 1 is not a clear label whereas Co-educational School is a clear label). On the following page provided for each part, a report on these analyses should be written up. One report only is required for each part, with the report addressing both English and Mathematics scores in regard to the Reseach Question. Reports should follow the format described in the report writing document on iLearn, with particular attention to the section 'A Short Guide to Report Writing for STAT170 students'. Each report will have an Introduction, a Methods section, a Results section and a Conclusion as outlined in the report writing document. Reports should not be more than one A4 page in length.

Research Questions for Q2:

a. Amongst students attending boys only schools, did the average marks on standardised exams change significantly between Years 7 and 11? 

b. Amongst Year 11 students, were the average marks on standardised exams for students at Government schools different to the average marks for students at Independent schools?

c. Amongst Year 7 students at were the average marks on standardised exams for for students at boys only schools different to the average marks for students at girls only schools?

Attachment:- Assignment.rar

Reference no: EM131067168

Questions Cloud

Common food items in a primate diet : Incisors are generally used to pre-process food items. In other words, they are used to take bite-sized portions out of a large food item. Of the three most common food items in a primate diet (fruits, leaves, insects), which do you think requir..
Focusing sustained attention on a task : Attention deficit disorder (ADD) is a syndrome in which a person has difficulty focusing sustained attention on a task for a significant amount of time. In some cases this is accompanied by hyperactivity as well. It is currently being diagnosed at..
Provide strong and supportive leadership to all staff : Provide strong and supportive leadership to all staff who work for me. Regularly coming up with new & effective ways of making the distribution process more effective.
Nervous systems creative presentation : For this assignment, you will demonstrate your understanding of nervous systems in a creative presentation.
Whether the number of student enrolments at remote schools : Use an appropriate hypothesis test to determine whether the number of student enrolments at very remote schools in 2014 was a useful predictor of the number of teaching staff
Side of the body in one of patients : You are a neurologist and perform a patellar reflex on each side of the body in one of your patients. You notice that the left side reflex doesn't work. The patient can feel a gentle sweeping motion on the thigh in both legs, cannot voluntarily..
Compute the bonds current yield-yield to maturity : A 5.25% coupon municipal bond has 16 years left to maturity and has a price quote of 96.75. The bond can be called in 6 years. The call premium is one year of coupon payments. Compute the bond's current yield, yield to maturity, taxable equivalent yi..
How many parts need to be made each month to break even : The cost of machinery for a project is $400,000. Expected life of the equipment is 4 years with a 10% salvage. direct labor is $30 per hour. The production rate is 15 parts per hour. Direct material is $12.37 per unit. how many parts need to be made ..
Firms degree of accounting operating leverage : Synthgration has a degree of pretax cash flow operating leverage equal to 1.266. If the firm's EBITDA was $1,500 last year while its depreciation and amortization expense was $100 in the same year, then what was the firm's degree of accounting operat..

Reviews

Write a Review

Basic Statistics Questions & Answers

  An analyst from an energy research institute in california

an analyst from an energy research institute in california wishes to precisely estimate a 99 confidence interval of the

  Claim of returning to work

The claim that ""40% of those persons who retired from an industrial job before the age of 60 would return to work if a suitable job was available" is to be investigated at the 0.02 level of risk.

  Confidence interval and hypothesis testing in statistics

A sample of 25 MBA students taking OTM course in the Spring of 2013 shows an average income of $85,000 with the sample standard deviation of $5,000. Find the 95% confidence interval of the population mean income of MBA students.

  Standard deviations and interquartile ranges

Q) Construct two sets of numbers with at least five numbers in each set with following characteristics;

  Highest level of education

One reads that a business school graduate with an undergraduate degree earns more than a high school graduate with no additional education, and a person with a master's degree or a doctorate earns even more.

  Determine which women asked to participate in study

Assume a sample of 25 women is needed for the study. What type/s of method/s of random selection can you use to determine which women should be asked to participate in the study?

  Number of breakdowns probability 1 005 2 005 3 010 4 010 5

abc manufacturing has 8 machines that perform a particular task. breakdowns occur frequently for this machine. past

  Summarize the above information in a table

a) Summarize the above information in a table b) Assuming that the factory can sell all the printers and scanners that it assembles, formulate the above information into a Linear Programming problem.

  Two-attribute utility function

What other attributes are important in a job decision? Would the two-attribute utility function you just assessed be useful as a first approximation if many of the other at- tributes were close in comparing two jobs?

  Find the equilibrium quantity and equilibrium price

Find the equilibrium quantity and equilibrium price for the commodity whose supply and demand functions are given

  Employees voted for president bush

a. How many of the employees would you expect to have voted for President Bush? b. All of the employees indicated that they voted in the 2004 presidential election. Determine the probability of this assuming they followed the national trend. c. Ei..

  Research process and modern business world

Albert Einstein stated, "The formulation of a problem is far more often essential than its solution, which may be merely a matter of mathematical or experimental skill.

Free Assignment Quote

Assured A++ Grade

Get guaranteed satisfaction & time on delivery in every assignment order you paid with us! We ensure premium quality solution document along with free turntin report!

All rights reserved! Copyrights ©2019-2020 ExpertsMind IT Educational Pvt Ltd