Reference no: EM131515930
Assignment:Supply and Demand
General Instructions for all Assignments
1. Unless specified differently by your course instructor, save this assignment template to your computer with the following file naming format: Course number_section number_Last_First_unit number
2. At the top of the template, insert the appropriate information: Your Name, Course Number and Section, and the Date
3. Insert your answers below, or in the appropriate space provided for in the question. Your answers should follow APA format with citations to your sources and, at the bottom of your last page, a list of references. Your answers should also be in Standard English with correct spelling, punctuation, grammar, and style (double spaced, in Times New Roman, 12-point, and black font). Respond to questions in a thorough manner, providing specific examples of concepts, topics, definitions, and other elements asked for in the questions.
4. Upload the completed Assignment to the appropriate Dropbox.
5. Any questions about the Assignment, or format questions, should be directed to your course instructor.
Assignment
In this Assignment, you will demonstrate your understanding of the Production Possibility model, marginal opportunity costs, and the differences in marginal opportunity costs. Additionally, you will demonstrate a clear understanding of the crucial concept of supply and demand, and the impact on the original group caused by achange in demand.
In this Assignment, you will be assessed on the following outcome:
AB224-1: Examine how various supply and demand scenarios affect the way prices and quantities are set by market interactions in perfectly competitive markets.
Questions
1. In ancient days a tribe of natives on the mythical continent of Atlantis was able to produce two commodities to eat. They could harvest fish from the sea and they could grow a form of wild oats.Table 1.a. and Graph 1.a. both show the maximum annual output combinations of fish and wild oats that could be produced by the natives of Atlantis.
|
Table 1.a.
|
|
|
Maximum annual output options
|
Kilograms of fish
|
Bushels of wild oats
|
|
1
|
7,000
|
0
|
|
2
|
6,000
|
300
|
|
3
|
5,000
|
500
|
|
4
|
4,000
|
625
|
|
5
|
3,000
|
710
|
|
6
|
2,000
|
775
|
|
7
|
1,000
|
825
|
|
8
|
0
|
850
|
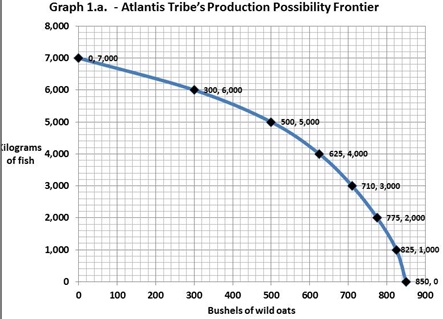
a. Could the Atlantis tribe have produced800 bushels of wild oats and 5,000 kilograms of fish at the same time? Explain your answer. Where would this point lie relative to the production possibility frontier?
b. Using Table 1.a., what would have been the marginal opportunity cost of increasing the annual output of wild oats by 200 bushels, from 300 bushels up to 500 bushels?
c. Using Table 1.a., what would have been the marginal opportunity cost of increasing the annual output of wild oats by 200 bushels, from 625 bushels up to 825 bushels?
d. Whyare the marginal opportunity costs for two similar batches of 200 bushels of wild oats not the same? Explain. What does this difference imply about the shape of the Atlantis tribe's production possibility frontier curve?
2. In the neighboring groups of New Yorkers and New Jersians, each produces only two products, bagels and calzones. By themselves, the New Yorkers, each day, can produce either 45 pounds of bagels and no calzones, or 30 pounds of calzones and no bagels, or any combination in between. The New Jersians, by themselves, each day, can produce 30 pounds of bagels and no calzones, or 28 pounds of calzones and no bagels, or any combination in between. Diagram 1.a. shows the daily Production Possibility Frontier for the New Yorkers and Diagram 1.b. shows the daily Production Possibility Frontier for the New Jersians.
a. Examine diagram 1.a. showing the daily Production Possibility Frontier for the New Yorkers and diagram 1.b. showing the daily Production Possibility Frontier for the New Jersians. Which group has the absolute advantage in bagels production? Show your calculations and explain why.
b. Examine diagram 1.a. showing the daily Production Possibility Frontier for the New Yorkers and diagram 1.b. showing the daily Production Possibility Frontier for the New Jersians. Which group has the absolute advantage in calzones production? Show your calculations and explain why.
c. Examine diagram 1.a. showing the daily Production Possibility Frontier for the New Yorkers and diagram 1.b. showing the daily Production Possibility Frontier for the New Jersians. Which group has the comparative advantage in calzones production? Show your calculations and explain why.
d. Examine diagram 1.a. showing the daily Production Possibility Frontier for the New Yorkers and diagram 1.b. showing the daily Production Possibility Frontier for the New Jersians. Which group has the comparativeadvantage in bagels production? Show your calculations and explain why.
Later, the New Yorkers discover a new technology for making calzones that dramatically increases the quantity of calzones they can produce each day. Diagram 1.c. shows both the old and the new daily production possibility frontier for the New Yorkers. The New Yorkers, each day, can now produce either 45 pounds of bagels and no calzones, or 50 pounds of calzones and no bagels, or any combination in between. Diagram 1.c. shows both the old and the new daily Production Possibility Frontiers for the New Yorkers and Diagram 1.b. shows the unchanged daily Production Possibility Frontier for the New Jersians.
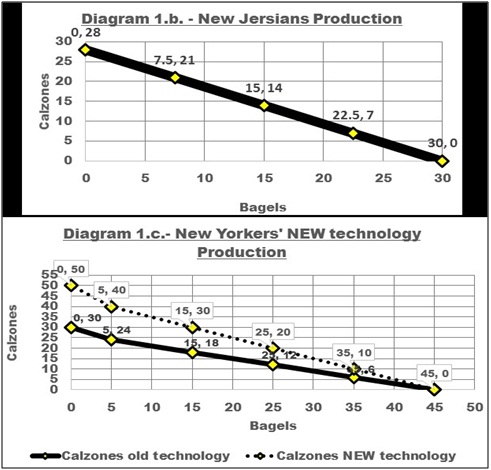
e. Examine diagram 1.c. showing both the old and the new daily Production Possibility Frontier for the New Yorkers and diagram 1.b. showing the daily Production Possibility Frontier for the New Jersians. Which group NOW has the absolute advantage in bagels production? Show your calculations and explain why.
f. Examine diagram 1.c. showing both old and the new daily Production Possibility Frontier for the New Yorkers and diagram 1.b. showing the daily Production Possibility Frontier for the New Jersians. Which group NOW has the absolute advantage in calzones production? Show your calculations and explain why.
g. Examine diagram 1.c. showing both the old and the new daily Production Possibility Frontier for the New Yorkers and diagram 1.b. showing the daily Production Possibility Frontier for the New Jersians. Which group NOW has the comparative advantage in bagels production? Show your calculations and explain why this is important.
h. Examine diagram 1.c. showing both old and the new daily Production Possibility Frontier for the New Yorkers and diagram 1.b. showing the daily Production Possibility Frontier for the New Jersians. Which group NOW has the comparative advantage in calzones production? Show your calculations and explain why this is important.
3. Suppose that the supply schedule of Brazilian Coffee beans is as follows:
|
Price of Brazilian Coffee beans
(per pound)
|
Quantity of Brazilian Coffee beans supplied
(pounds)
|
|
$4.00
|
6,000
|
|
$3.50
|
5,000
|
|
$3.00
|
4,000
|
|
$2.50
|
3,000
|
|
$2.00
|
2,000
|
Suppose that Brazilian Coffee beans can be sold only in Brazil. The domestic Brazilian demand schedule for Brazilian Coffee beans is as follows:
|
Price of Brazilian Coffee beans
(per pound)
|
Brazilian Quantity of Brazilian Coffee beans demanded
(pounds)
|
|
$4.00
|
1,000
|
|
$3.50
|
2,500
|
|
$3.00
|
4,000
|
|
$2.50
|
5,000
|
|
$2.00
|
7,000
|
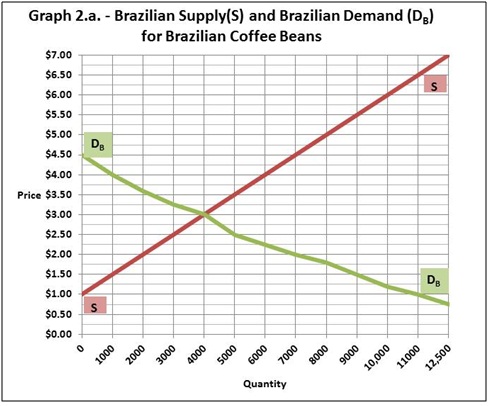
a. Below is the graph of the domestic Supply and Demand (Graph 2.a.) for Brazilian Coffee beans. From the supply and demand schedules above, what are the equilibrium price and quantity of Brazilian Coffee beans?
Now suppose that Brazilian Coffee beans can also be sold in Canada. The Canadian demand schedule for Brazilian Coffee beans is as follows:
|
Price of Brazilian Coffee beans
(per pound)
|
Canadian Quantity of Brazilian Coffee beans demanded
(pounds)
|
|
$4.00
|
1,000
|
|
$3.50
|
2,500
|
|
$3.00
|
3,000
|
|
$2.50
|
5,000
|
|
$2.00
|
5,500
|
b. Complete the following table by inserting the total Brazilian Coffee beans demanded by both the Brazilians and Canadians at each price (the combined (total) demand schedule for Brazilian Coffeebeans).
|
Price of Brazilian Coffee beans
|
Canadian Quantity of Brazilian Coffee beans demanded
|
Brazilian Quantity of Brazilian Coffee beans demanded
|
Total Brazilian Coffee Demanded
|
|
(per pound)
|
(pounds)
|
(pounds)
|
(pounds)
|
|
$4.00
|
1,000
|
1,000
|
|
|
$3.50
|
2,500
|
2,500
|
|
|
$3.00
|
3,000
|
4,000
|
|
|
$2.50
|
5,000
|
5,000
|
|
|
$2.00
|
5,500
|
7,000
|
|
Below is the new Supply and Demand graph (Graph 2.b.) that illustrates the equilibrium price and quantity of Brazilian Coffee beans.
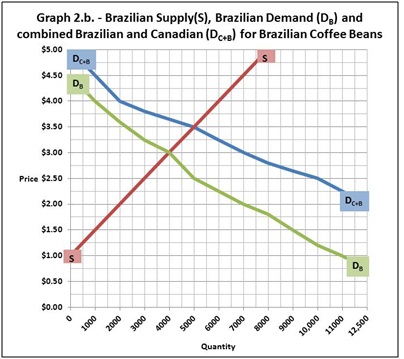
c. From the supply schedule and the combined Canadian and Brazilian demand schedule, what will be the new price at which Brazilian coffee growers can sell Brazilian Coffee beans?
d. With the Brazilian coffee growers sellingto both the Canadians and the Brazilians, what price will be paid by Brazilian consumers?
e. With the Brazilian coffee growers selling to both the Canadians and the Brazilians, what will be the quantity consumed by Brazilian consumers?