What will the predicted perception of use

Assignment Help Applied Statistics
Reference no: EM133566932

Quantitative Techniques

Case A: Regression Analysis

An apps developer for Fintech has commissioned a consultant firm to understand the desired features and the perception of use. The perception of use has been collected from different workstations and from different types of users. The independent characteristic or features will affect the attractiveness of the ease of apps. A higher level of perception (ease of use) will drive higher usage and higher profitability of the Fintech eventually.

The consultant perceived that the security level (independent variable) will drive better perception of use (dependent variable). The consultant will need to analyze the relationship of the security level with perception of use. A predictive regression will be used to predict the ability of security level to influence app usage.

A five-point Likert scale (1 for lowest and 5 for highest) has been used to measure the intended variables. The numbers are average of different users from 30 different workplaces and environments. Data has been tabulated as shown in the table below.

Question 1
1) The consultant will need to visualize the relationship in a scattered plot. Draw a scattered plot.
2) Is there a statistical relationship between the s security level (independent variable) with perception of use (dependent variable). Describe the relationship.
(Hint: You can solve it through manual computation or resolved through software or MS Excel analysis Tool pack)
3) State and interpreted the regressed model and equation. What will the predicted perception of use if app developer established the security level at 3?


1

2

3

4

5

6

7

8

9

10

Security Level

2.5

3.2

4.5

4.3

3.6

3.8

4.6

4.7

2.4

2.8

Perception Use

1.3

3.5

4.7

4.8

4.1

3.9

4.8

5

3.1

3


11

12

13

14

1$

16

17

18

19

20

Security Level

3.5

3.4

3.7

4.6

1.5

4.5

4.6

4.7

3.8

3.6

Perception Use

4.2

3.8

4.2

4.8

1.2

4.2

4.8

4.8

4.1

4


21

22

23

24

2$

26

27

28

29

30

Security Level

3.50

3.80

3.80

4.30

4.80

2.80

3.20

3.20

3.10

3.00

Perception Use

3.8

4.2

4.2

4.8

5

2.8

3.6

4.1

3.8

3.5

Table 1: Data (sample 30) collected from 5 Points Likert Scale

Question 2

In addition, the amount of storage has affected users to install any application. The consultant has included the variable in their survey. The hypothesized relationship is shown in Figure 1. The regressed model is shown in Table 2 below as well.

1451_Hypothesized Relationship.jpg

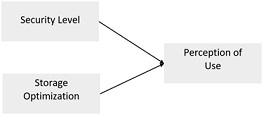
Figure 1: Hypothesized Relationship

ANOVA


df

SS

MS

F

Significance F

Regression

2

21.41750

10.70875

68.97064

0.0000

Residual

27

4.19216

0.15527


Total

29

25.60967


Coefficients       Standard Error            t Stat               P-value

Intercept

0.0005

0.3942

0.0012

0.9991


Security level

0.9526

0.4273

2.2295

0.0343


Storage Optimal

0.1255

0.4829

0.2598

0.7970


Table 2: Regressed Model #2

a) State the significant predictor and the multiple regression model.

b) Provide a short summary or recommendation to the Fintech software developer.

Case B: Quantitative Decision Analysis

There is the opportunity Andaman Sdn Bhd. to expand business to construct a new warehouse for an existing e-commerce company. The are two options. The first option is to expand at site A and the other option is to expand at site B. Both site A and B offer different payoffs with different levels of investment. The company can either expand at site A (RM6 million construction cost) OR site B (RM10 million construction cost). The project manager wanted to evaluate the options for a project (new warehouse) expansion objectively based on the expected monetary value (EMV).

The TWO possible options are listed in Table 2 below:

Option

Payoff

Site A

Site A has a favorable outcome of 60% with RM15 million estimated profit and an unfavorable 40% chance of RM2 million estimated profit.

Site B

Site B has a favorable outcome of 70% RM30 million estimated

profit and an unfavorable 30% chance of RM6 million estimated profit.

Table 3: Option payoff and investment at Project at Site A and B

Question 3
a) As a consultant, explain to the construction manager the benefits of using a decision tree to determine EMV.

b) Based on this scenario (draw a decision tree with EMV), state your recommendation to the construction manager.

Question 4
Based on real example - for example at work, business or relevant business or social associates- state an application of quantitative and qualitative business interpretation created value.

You will state a scenario. Provide (mockup) a few numerical examples (shown in table or graphs). State how it has been used to provide value.

Reference no: EM133566932

Questions Cloud

How school counselors use data to inform decision-making : discuss how school counselors use data to inform decision-making (in other words, what decisions about programs or students will knowing this data help you make
Describe the psychosocial issue currently facing : Needs housing and wants to get off income assistance. Describe the psychosocial issue currently facing v the individual, name the agency youbhave referred
Which do you think is most pertinent to your current life : How do you think Karen Horney's thoughts on "the role of culture" from the book "The Humanistic Psychoanalytic Perspective" relate to one or more
Discuss what impact an organizations corporate culture have : Based on the two articles you read in discussion preparation, discuss what impact an organization's corporate culture have on maintaining and sustaining change?
What will the predicted perception of use : BBM511/03 Quantitative Techniques, Wawasan Open University - State and interpreted the regressed model and equation. What will the predicted perception of use
Discuss how you believe telemedicine utilization may either : Discuss how you believe telemedicine utilization may either be beneficial or detrimental to providing evidence-based treatment tools, assessments
Discuss the extent of inequality in society is often related : Discuss the extent of inequality in society is often related to the way economic and political systems are structured.
Why do fewer girls than boys pursue careers in science : Why do fewer girls than boys pursue careers in science, technology, engineering and math? It's not because of any inherent gender differences in ability.
Develop your thesis through qualified sub-points : Develop your thesis through qualified sub-points. Discuss the steps in chronological order. Show critical analysis, rather than just reporting of facts.

Reviews

Write a Review

Applied Statistics Questions & Answers

  Generate a frequency distribution and histogram

Generate a frequency distribution and histogram describing this information. Do any of the portfolio values seem to be especially large or small compared to the others?

  Q1in the work represented in the image below describe how

q1.in the work represented in the image below describe how each of the following manifest if at alla.nbsp awkward

  Determine the level of measurement for the variables

SPSS was used to analyze the data from a survey of persons to determine the predictors for whether or not a person had good physical health

  Daily machines breakdown in manufacturing floor

Daily machines breakdown  in manufacturing floor were maintained by manufacturing engineer, with the following results

  Show the classification matrix for the validation data

CSC550 Assignment - Answer the following questions - Show the classification matrix for the validation data that results from using the best k

  Calculate the degrees of freedom

Use the following data to conduct a difference of means test: Calculate the degrees of freedom. Compare the t-statistic to the critical value for p = 0.05 for the corresponding degrees of freedom

  Interpret the results and compare the widths of the confiden

In a survey of 616 males ages 18-64, 393 say they have gone to the dentist in the past year. Construct90% and95% confidence intervals for the population proportion. Interpret the results and compare the widths of the confidence intervals. If convenie..

  The united states will develop shingles

1 out of 3  people in the united states will develop shingles during their lifetime. imagine that you are a doctor who is about to examine 10 unrelated adults selected at random and before you examine them we ask you what are the chances that.a. At l..

  What is the average number of breakdowns per day

This variable represents the number of machine breakdowns during a day, based on this simulation run, what is the average number of breakdowns per day?

  Strategic placement of lobster traps is one of the keys for

Strategic placement of lobster traps is one of the keys for a successful lobster fisherman. An observational study of teams fishing for the red spiny lobster in Baja California Sur, Mexico, was conducted and the results published in Bulletin of Marin..

  Plot two separate scatter diagrams of demand for coffee

Plot 2 separate scatter diagrams of demand for coffee, Y, against, X_1, real price of coffee and real personal disposable income, X_2.

  Political polls typically sample randomly from the u.s

Political polls typically sample randomly from the U.S population to investigate the percentage of voters who favor some candidate or issue. The number of people polled is usually on the order of 1000. Suppose that one such poll asks voters how they ..

Free Assignment Quote

Assured A++ Grade

Get guaranteed satisfaction & time on delivery in every assignment order you paid with us! We ensure premium quality solution document along with free turntin report!

All rights reserved! Copyrights ©2019-2020 ExpertsMind IT Educational Pvt Ltd