Reference no: EM13745461
1.
|
Wage rate (dollars per hour)
|
Quantity demanded (hours per month)
|
Quantity supplied (hours per month)
|
|
3
|
800
|
400
|
|
4
|
700
|
500
|
|
5
|
600
|
600
|
|
6
|
500
|
700
|
|
7
|
400
|
800
|
The table above shows the demand for and supply of labor in a small less developed country.
a) Currently, the minimum wage is set at $4.50 per hour. How many hours are worked? How many hours of labor are unemployed?
b) If the minimum wage is raised to $6 per hour, what are employment and unemployment?
2.
|
Rent (dollars per month)
|
Quantity demanded (units per month)
|
Quantity supplied (units per month)
|
|
500
|
1,200
|
0
|
|
600
|
1,000
|
100
|
|
700
|
800
|
200
|
|
800
|
600
|
300
|
|
900
|
400
|
400
|
|
1,000
|
200
|
500
|
|
1,100
|
0
|
600
|
The table above shows the demand for and supply of rental housing in Crainsboro. The city government is considering imposing a rent ceiling of $700 a month. Help the government to analyze the effects of the proposed rent ceiling.
a) With no rent ceiling, what is the rent and how many apartments are rented?
b) If the government imposes the $700 a month rent ceiling, how many apartments are rented? Is this a binding price ceiling?
3.
|
Price (dollars per chip)
|
Quantity demanded (millions of chips per year)
|
|
200
|
50
|
|
250
|
45
|
|
300
|
40
|
|
350
|
35
|
|
400
|
30
|
a) What happens to total revenue if the price falls from $400 to $350 a chip and from $350 to $300 a chip?
b) What is the price elasticity of demand if the price increases from $300 to $350? You must show all of your work to receive full credit.

4.
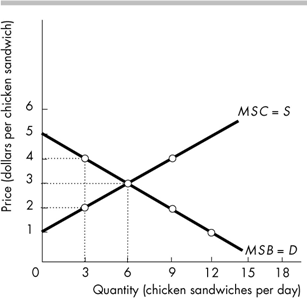
The above figure illustrates the marginal social benefit and marginal social cost for chicken sandwiches.
a) At equilibrium price, how many chicken sandwiches would be purchased?
b) What is the amount of consumer surplus at the equilibrium price?
c) At the equilibrium price, what is the amount of total surplus in the market?
d) If the price of chicken sandwiches increased to $4, how does consumer surplus change?
e) If the price of chicken sandwiches decreased to $2, how does producer surpus change?

5.
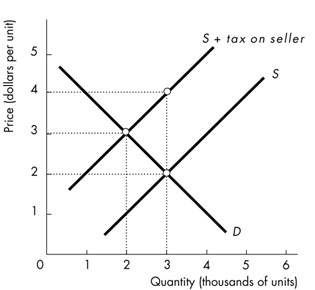
Using the graph shown, answer the following questions.
a. What was the equilibrium price in this market before the tax?
b. What is the amount of the tax?
c. How much will the buyer pay for the product after the tax is imposed?
d. How much will the seller receive after the tax is imposed?
e. How much of the tax will buyers pay?
f. How much of the tax will sellers pay?
g. As a result of the tax, what has happened to the level of market activity?