Reference no: EM132392108
Assignment
The purpose of this assignment is to give you the opportunity to determine appropriate tests to run, carry out the analyses, and interpret the results of the statistics. Be sure to open this document and SAVE IT as yourlastnamelabfinal.doc to the desktop. Be sure to copy and paste output where specified in the instructions (do not submit a separate output file).
Part A: Use SPSS data file FinalPartA.sav
QUESTION 1
You want to know if participants in your sample performed significantly differently than the population of national students on a math exam (Variable TESTSCORE in the data set). You know that the population has a mean of 79.20.
A. What test do you want to conduct?
B. Conduct the test that you named in Step A. Paste the output into your Word document.
C. Describe your result as if you were reporting it in a journal article.
QUESTION 2
People in your study rated how attractive they found a potential romantic partner while under the influence of alcohol (variable: ATTRAC_ALC) and again completely sober (variable: ATTRAC_SOB) on an interval scale from 1-14 where higher numbers indicate reports of greater levels of attractiveness. Did alcohol influence ratings of attractiveness?
A. What test do you want to conduct?
B. Conduct the test that you named in Step A. Paste the output into your Word document.
C. Describe your result as if you were reporting it in a journal article.
QUESTION 3
A researcher is interested in comparing the effects of free time on creativity. One group of children was given 30 minutes of totally unstructured play time (“Unstructured”) and another was given 30 minutes in which an observer directed the child’s play time (“Structured”). All children were then asked to draw a picture of something they had imagined. Pictures were coded by independent observers for their creativity (higher numbers mean more creativity). The researcher conducted a t-test for independent means on the data. The SPSS output is below.
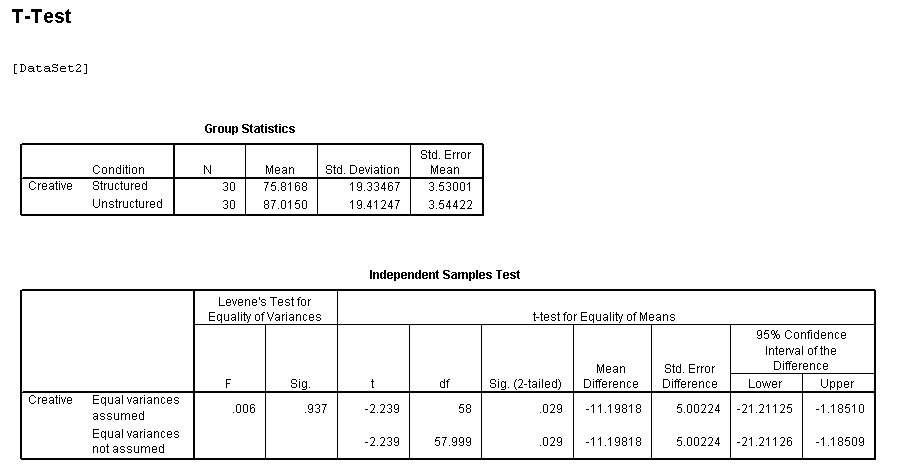
Describe what Levine’s Test for Equality of Variances tells us. Indicate why it is important, and how you evaluate and use the information provided under “Levine’s Test for Equality of Variances.”
Describe the results of the t-test in plain English – be sure to be thorough and complete in your answer, and to indicate what information you are using to draw your conclusion. Write per APA guidelines.
QUESTION 4
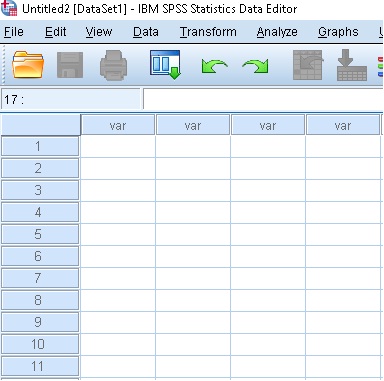
You are comparing the working memory of patients with bipolar disorder and patients without bipolar disorder. Working memory is on a scale from 0-100 with higher numbers indicating better working memory. Imagine that you have three participants in each group, with their working memory scores as follows:
Patients with bipolar disorder: 75, 80, 65
Patients without bipolar disorder: 79, 76, 63
In a blank SPSS data set (see below) show how you would enter your data if you wanted to compare the two groups’ working memory.
In SPSS “Variable View” add in appropriate “Label” and “Measure” as appropriate.
Part B
For the remainder of the exam, use the data file called “FinalPartB.sav”
About these data:
Roy Baumeister and his colleagues study self-regulation. In other words, they ask why don't we eat all of the tasty tidbits we encounter, attend parties when we should be studying, and have sex with every attractive potential partner who crosses our path? In short, how do we manage to forgo temptation? An exploration of (fictitious) data regarding these questions will comprise the bulk of the final lab exam.
The data set you opened represents scores of 800 recent college graduates who participated in a study.
First, participants were asked to control their emotions while watching a very sad movie, and then completed challenging set of brain teasers. One week later, participants returned to the lab and again watched a sad movie. This time, they were not asked to control their emotions and completed a different (but equally challenging) set of brain teasers. In both cases, the researchers measured how much participants persisted at the difficult brain teasers. The variables in this data set are:
|
SUBJECT
|
Unique subject identifier from 1-800
|
|
PERSONALITY
|
Personality Type (0 = Introvert; 1 = Extrovert)
|
|
CTRL_PER
|
Persistence after watching a sad movie and being asked to control emotions (1-10 scale; higher numbers indicate greater persistence).
|
|
NO_CTRL_PER
|
Persistence after watching a sad movie and NOT being asked to control emotions (1-10 scale; higher numbers indicate greater persistence).
|
|
NEED_CTRL
|
Self-report of need for control in the environment, measured two months before participating in the study (1-5 scale; higher numbers indicate greater need for control over one's environment)
|
|
JOB
|
First job or activity following college graduation (0 = Public service job; 1 = Graduate school; 2 = Travel; 3 = Private sector job)
|
QUESTION 5. In Variable View, add in “Labels” and “Values” so it is easier to interpret your findings.
QUESTION 6. Create a new variable that represents the z-score of persistence on the brain teasers after being asked to control emotions (CTRL_PER).
SAVE FILE AS “LASTNAMEQ5.SAV” (SPSS WILL AUTOMATICALLY ADD THE .SAV EXTENSION TO DATA FILES). Be sure the file contains answers to both Q5 and Q6. BE SURE TO ATTACH THIS FILE TO BLACKBOARD
QUESTION 7. Describe your sample. Generate frequency tables and bar charts for the nominal variables. Generate and interpret descriptive statistics of central tendency for any continuous (scale) variables and include histograms with the normal curve superimposed for each scale variable. Label your tables and graphs according to APA format. Conclude with a paragraph summarizing the demographic characteristics of this sample.
QUESTION 8. Analyze whether self-reported need to control one’s environment has any significant outliers. Write up your conclusion (using stats and a figure to back up your conclusions). Report what you would do if you do find any outliers (delete, remove, transform), but leave the variable as is.
QUESTION 9. Is self-reported need to control one’s environment associated with persistence scores when participants did not control their emotions after watching a sad move (variable NO_CTRL_PER)?
A. What is the appropriate test to conduct to answer this question?
B. Conduct the appropriate test to answer this question. Paste your output in your Word document.
C. Write your results in APA format as if you were writing them in a journal article.
QUESTION 10. Do introverts and extroverts differ in their need to control their environment?
A. What test do you want to perform to answer this question?
B. Conduct the test you indicated in Part A. Paste your output into your Word document.
C. Write your results in APA format as if you were reporting them in a journal article.
QUESTION 11. Does persistence differ depending on whether people are controlling their emotions after watching a sad movie?
A. What test do you want to perform to answer this question?
B. Conduct the test you indicated in part A. Paste your output into your Word document.
C. Write your results as if you were reporting them in a journal article.
QUESTION 12. A. Create a frequency table in SPSS that shows how many students plan to pursue each job or activity following graduation. Paste into your Word document.
B. What percent of people plan to travel following graduation?
QUESTION 13. Does persistence after watching a sad movie and being asked to control emotions vary depending on job plans?
The following questions are:
A. What test do you want to perform to answer this question?
B. Conduct the test you indicated in part A. Paste your output into your Word document.
C. Include a figure and describe what you see.
D. Write your results as if you were reporting them in a journal article.
QUESTION 14. Exclude all participants who had a score of 10 on the variable CTRL_PER. (Choose Data – Select Cases – If condition is satisfied and specify that the variable should be < 10). All subsequent questions will be using the data without these participants!
QUESTION 15. Report the following for scores on “Need for Control:”
Mean ________ Median ________ Mode ________
Variance ________
N ________
QUESTION 16. A group of psychologists was interested in what kind of humor people find funny. They randomly assigned people to read about different types of humor (knock knock jokes, puns, sarcasm, or practical jokes) and rate how funny each joke, comment, or situation was. Ratings were made on 1 (not at all funny) to 10 (extremely funny) scales.
They then conducted a one-way ANOVA with a Tukey post-hoc test to see if there were differences in average ratings of humor across the four different groups. SPSS output is below.
Describe these results in plain English – be sure to be thorough and complete in your answer, and to indicate what information you are using to draw your conclusion. Write per APA guidelines.
QUESTION 17. An industrial psychologist was hired by a company to determine whether gender and work location impacted confidence. The results of this study are presented in the figure below.
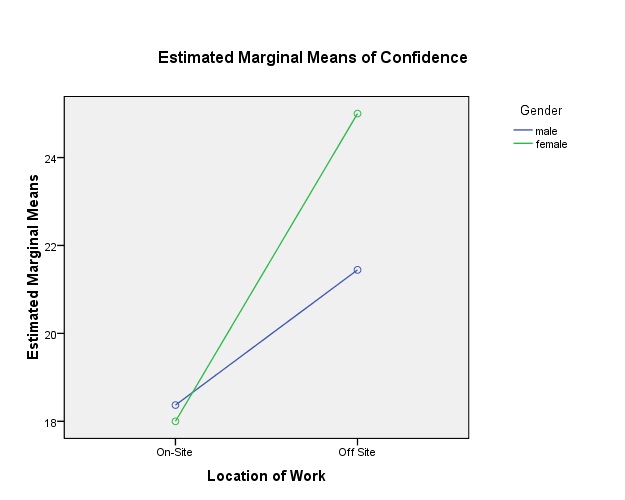
A. What test of statistical test was performed? You should base your answer on the study description as well as the figure above.
B. Number and label the figure per APA guidelines.
C. Write hypotheses for the impact of gender and work location on confidence.
D. Describe the results of the study based on what you see in the figure.
QUESTION 18. A researcher is interested in whether age, years of experience, or confidence predict certification exam scores?
A. What statistical test would you recommend?
B. Using the output below, what was the best predictor of exam scores: age, years of experience, or confidence? Use statistics to back up your answer.
C. Were there any other variables that improved the ability to predict performance on the certification exam? Use statistics to back up your answer.
D. Were there any other variables that did not predict performance on the certification exam?
E. What is the best model? Write up the results of the overall test per APA guidelines.
F. Using the coefficients table, write up an equation and explain what this means.
G. What type of figure would you want to see to help interpret this data?
|
Descriptive Statistics
|
|
|
Mean
|
Std. Deviation
|
N
|
|
Certification Exam
|
69.65
|
10.667
|
60
|
|
Age
|
37.38
|
8.988
|
60
|
|
Years of Experience
|
5.87
|
4.436
|
60
|
|
Confidence
|
21.43
|
5.518
|
60
|
|
Correlations
|
|
|
|
Certification Exam
|
Age
|
Years of Experience
|
Confidence
|
|
Pearson Correlation
|
Certification Exam
|
1.000
|
.610
|
.444
|
.596
|
|
Age
|
.610
|
1.000
|
.639
|
.426
|
|
Years of Experience
|
.444
|
.639
|
1.000
|
.448
|
|
Confidence
|
.596
|
.426
|
.448
|
1.000
|
|
Sig. (1-tailed)
|
Certification Exam
|
.
|
.000
|
.000
|
.000
|
|
Age
|
.000
|
.
|
.000
|
.000
|
|
Years of Experience
|
.000
|
.000
|
.
|
.000
|
|
Confidence
|
.000
|
.000
|
.000
|
.
|
|
N
|
Certification Exam
|
60
|
60
|
60
|
60
|
|
Age
|
60
|
60
|
60
|
60
|
|
Years of Experience
|
60
|
60
|
60
|
60
|
|
Confidence
|
60
|
60
|
60
|
60
|
|
Variables Entered/Removeda
|
|
Model
|
Variables Entered
|
Variables Removed
|
Method
|
|
1
|
Age
|
.
|
Stepwise (Criteria: Probability-of-F-to-enter <= .050, Probability-of-F-to-remove >= .100).
|
|
2
|
Confidence
|
.
|
Stepwise (Criteria: Probability-of-F-to-enter <= .050, Probability-of-F-to-remove >= .100).
|
|
a. Dependent Variable: Certification Exam
|
|
Model Summaryc
|
|
Model
|
R
|
R Square
|
Adjusted R Square
|
Std. Error of the Estimate
|
|
1
|
.610a
|
.372
|
.361
|
8.525
|
|
2
|
.714b
|
.510
|
.493
|
7.595
|
|
a. Predictors: (Constant), Age
|
|
b. Predictors: (Constant), Age, Confidence
|
|
c. Dependent Variable: Certification Exam
|
|
ANOVAc
|
|
Model
|
Sum of Squares
|
df
|
Mean Square
|
F
|
Sig.
|
|
1
|
Regression
|
2498.802
|
1
|
2498.802
|
34.386
|
.000a
|
|
Residual
|
4214.848
|
58
|
72.670
|
|
|
|
Total
|
6713.650
|
59
|
|
|
|
|
2
|
Regression
|
3426.044
|
2
|
1713.022
|
29.700
|
.000b
|
|
Residual
|
3287.606
|
57
|
57.677
|
|
|
|
Total
|
6713.650
|
59
|
|
|
|
|
a. Predictors: (Constant), Age
|
|
b. Predictors: (Constant), Age, Confidence
|
|
c. Dependent Variable: Certification Exam
|
|
Coefficientsa
|
|
Model
|
Unstandardized Coefficients
|
Standardized Coefficients
|
|
|
B
|
Std. Error
|
Beta
|
t
|
Sig.
|
|
1
|
(Constant)
|
42.582
|
4.745
|
|
8.973
|
.000
|
|
Age
|
.724
|
.123
|
.610
|
5.864
|
.000
|
|
2
|
(Constant)
|
33.324
|
4.817
|
|
6.918
|
.000
|
|
Age
|
.517
|
.122
|
.435
|
4.248
|
.000
|
|
Confidence
|
.794
|
.198
|
.411
|
4.010
|
.000
|
|
a. Dependent Variable: Certification Exam
|
|
Excluded Variablesc
|
|
Model
|
|
Collinearity Statistics
|
|
Beta In
|
t
|
Sig.
|
Partial Correlation
|
Tolerance
|
|
1
|
Years of Experience
|
.092a
|
.677
|
.501
|
.089
|
.592
|
|
Confidence
|
.411a
|
4.010
|
.000
|
.469
|
.819
|
|
2
|
Years of Experience
|
-.032b
|
-.254
|
.800
|
-.034
|
.554
|
|
a. Predictors in the Model: (Constant), Age
|
|
b. Predictors in the Model: (Constant), Age, Confidence
|
|
c. Dependent Variable: Certification Exam
|
QUESTION 19. How is a moderation effect expressed statistically? That is, how does the moderator impact the relationship between the independent and dependent variable?
QUESTION 20. According to the Baron and Kenny model, how is a partial mediation expressed?
Attachment:- Data File.rar