Reference no: EM131082345
Discussion
Different types of graphs, which graphs are most appropriate for specific data, and when graphs are misleading. For instance, a graph can misrepresent the data if it does not provide a proper representation of the data, which can be caused by the vertical scale being too small or too large, or by not starting at 0. Additionally, if a graph does not have the proper labels or if data is left out, this can also result in a graph that does not properly represent the data.
1. What story does this visual display (graph) below tell? Describe the variables that are being compared. (Hint: There are three). Do you think that this is an accurate and fair description of the data? Is this graph clear or misleading? Why?
Source: https://calculatedriskimages.blogspot.com/2010/09/bls-education-pays.html
2. What story does the Pie Graph below tell? Describe what these data are representing. Do you think that this is an accurate and fair description of these data? Is this graph easy to understand? Name at least three things wrong with this graph and how you might correct them?
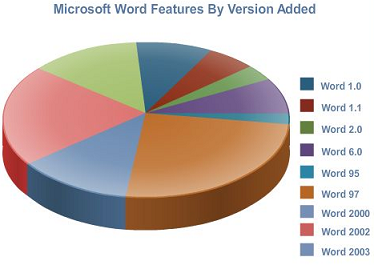
Source: https://blog.jgc.org/2009/08/please-dont-use-pie-charts.html
3. From this dataset, select any qualitative and discrete variable and create an appropriate graph that describes that variable. Be sure to fully label the graph. Attach graph separately.
Attachment:- Produce Graph from this excell Houses.rar
|
Creation of the organizational vision and mission
: A leader's job is to create the direction for the company to move forward. The leader does this in three major ways the creation of the organizational vision and mission, the structure, and culture. Here are the steps of the process:
|
|
Use the quotient rule to differentiate the function
: Quiz 5. Use the Quotient Rule to differentiate the function f(x) = (tan(x) - 1/sec x)
|
|
What are deadweight losses and what are their causes
: What are deadweight losses, and what are their causes? What are the market effects of a deadweight loss? What are the major factors that determine who will bear the burden of a tax or the incidence of a tax?
|
|
Suppose the production function in economy
: Suppose the production function in an economy is Y = K^0.5L^0.5, where K is the amount of capital and L is the amount of labor. The economy begins with 64 units of capital and 16 units of labor. How much output does the economy produce?
|
|
What story does the pie graph below tell
: What story does the Pie Graph below tell? Describe what these data are representing. Do you think that this is an accurate and fair description of these data? Is this graph easy to understand? Name at least three things wrong with this graph and h..
|
|
What state probation program will you apply to scenario
: Your instructor will provide you with the defendant scenario in preparation for the Key Assignment. What state probation program will you apply to this scenario?
|
|
What is the maximum height reached by the iphone
: An iPhone is thrown into the air, starting from a height of 1 meter off the ground, and with an initial velocity of 2 meters per second (written 2m/s). What is the maximum height reached by the iPhone
|
|
Factor of production that includes human-made resources
: Economists use the term capital to describe that factor of production that includes human-made resources such as factories, buildings, machinery and tools. A change in the price of hamburgers will shift the supply curve for hot dogs. If the price of ..
|
|
List the various hearings that will typically occur
: What are the potential hearings that might be involved in this case? Be sure to describe them from the time of arrest through appeal.
|