What proportion of females was completely cured

Assignment Help Applied Statistics
Reference no: EM132181365

Research Methods & Biostatistics for Food & Nutrition Sciences SPSS Biostatistics Assignment -

Please complete all 3 parts of this assignment.

PART 1 -

Coeliac disease is an autoimmune condition caused by gluten intolerance in those individuals who are genetically susceptible. Coeliac disease affects approximately 1% of the European population and results in damage to the lining of the gut. Symptoms of coeliac disease include diarrhoea, weight loss, pain and vomiting. If a gluten-free diet is not strictly followed, nutrient deficiencies can occur. On a standard gluten-free diet, approximately 80% of overweight coeliac patients will gain weight and 30% of normal weight coeliac patients will become overweight.

A study was carried out to assess the effect of a strict gluten-free diet on nutritional status of coeliac patients and healthy controls. Fifteen coeliac patients and fifteen healthy controls were recruited and followed a 6-month gluten-free diet. Blood samples were taken at baseline (before the diet) and 6-months later (after the diet) and used to assess iron, folate and vitamin B12 status. Body mass index (BMI) was also recorded before and after the diet intervention.

BMI and nutritional status measures of iron, folate and vitamin B12 before and after the diet intervention are given in DATA Assignment 1.0.sav (in Blackboard Learn assignment area) for both the coeliac patients and healthy controls.

1.1 What is the aim of the study? Give the null and alternate hypotheses.

1.2 Using SPSS, assess and comment on the normality of the data.

1.3 Produce a summary table of the baseline BMI and nutritional status data for the coeliac patients and controls, showing any statistical differences between the groups using appropriate statistical tests (assume all data are normal and present as means ± SD).

1.4 Carry out statistical tests to analyse the differences between baseline and post intervention measures and present these data in an appropriate table (assume all data are normal and present as means ± SD).

1.5 Write a short conclusion on the study.

PART 2 -

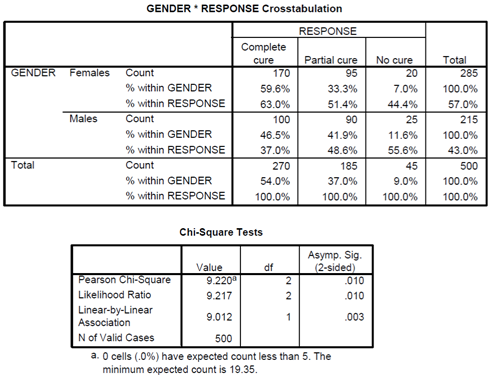
Antibiotics are powerful medicines that fight bacterial infections. In treating a patient, a doctor must know which antibiotics are most effective in either killing the organism or at least inhibiting or retarding its further growth. A study was carried out in which 500 patients admitted to hospital with bacterial infections were given a specific antibiotic and the response to the treatment recorded. The effectiveness of the antibiotic in the 500 patients is presented in the table below.


Complete cure

Partial cure

No cure

TOTAL

Females

170

95

20


Males

100

90

25


TOTAL


Use the data from the table above to answer the following questions:

2.1 What proportion of females was completely cured?

2.2 What proportion of those who were not cured is male?

2.3 What is the probability of selecting a person, from the sample of 500 subjects, who is female and was partially cured?

2.4 What percentage of the sample of 500 subjects is female?

2.5 The data in the table above were analysed using the chi-square test. The results from SPSS are shown below. What can you conclude from the results of the test?

1383_figure.png

PART 3 -

A study was carried out to assess maternal factors during pregnancy which influence birth outcomes. A total of 90 pregnant women were recruited at 12 weeks gestation and blood samples and anthropometric measurements were taken. The type of delivery, gestational age at delivery and anthropometric measurements of the baby were recorded at birth.

Using dataset labelled DATA Assignment 3.0.sav (in Blackboard Learn Assignments Area), complete the following questions.

3.1 Given the variables in the database, what is the aim of the study? Give the null and alternate hypotheses

3.2 Produce a summary table of the age, height, weight and BMI data for the pregnant women according to 'Type of Delivery', showing any statistical differences between the 'type of delivery' groups using appropriate statistical tests (assume all data are normally distributed).

3.3 If the data were not normally distributed, what summary statistics would you produce within a table and what statistical tests would you carry out to assess differences between 'type of delivery' groups?

3.4 Write a short conclusion on the study based on your findings from question 3.2.

Attachment:- Assignment Files.rar

Reference no: EM132181365

Questions Cloud

What are the key symptoms of groupthink : What are the key symptoms of groupthink? What problems and shortcomings can arise in the decision-making process as a result of groupthink?
Utilizes dynamic programming : Utilizes dynamic programming to get all of the possible original documents (i.e. with white spaces between words) and ranks them in order of likelihood
Describe various forms of business entities he might choose : Describe the factors that are relevant when choosing a business entity and describe the various forms of business entities he might choose.
Examine the pros and cons of automated grading within this : Examine the pros and cons of automated grading within this LMS. Determine the main types of questions or assignments that can be auto graded within the LMS.
What proportion of females was completely cured : NUT821: Research Methods & Biostatistics for Food & Nutrition Sciences SPSS Biostatistics Assignment - What proportion of females was completely cured
Write a professional development plan for your career : Influences: A brief description of any additional forces (social, economic, political, or institutional) that may influence your nursing education role.
Communications strategy for new weight loss drug case : As indicated in the Metabical: Positioning and Communications Strategy for a New Weight Loss Drug case,
Major recipients of the tarp funds : What is TARP and who were the major recipients of the TARP funds and how much did they get?
Determine the flatness or steepness of the lm curve : Could you help me to understand what factors determine the flatness or steepness of the LM curve?

Reviews

len2181365

11/29/2018 11:36:41 PM

Please complete all above 3 parts of this assignment. Notes - Do not copy and paste outputs directly from SPSS. Format tables as appropriate for publication including appropriate titles and footnotes (with statistical tests noted alongside other relevant information).

Write a Review

Applied Statistics Questions & Answers

  What percentage of pins will be acceptable to the customer

What percentage of the pins will be acceptable to the customer - In order to improve the percentage accepted, management considers adjusting the population mean and standard deviation of the length of the pins. If the lathe can be adjusted to have ..

  What is the probability that it came from supplier a

The company must also purchase connectors from two other suppliers, 20% from B and the rest from C. The rates of defective connectors from B and C are 2% and 4% respectively. You buy one and find that it is defective. What is the probability that it ..

  Average number of sports that colleges

A researcher hypothesized that the average number of sports that colleges offer for males is greater than the average number of sports that colleges

  What is the probability that a transaction can be completed

Transactions to a computer database are either new items or changes to previous item. The addition of an item can be completed. if 30% of the transactionss are changes what is the probability that a transaction can be completed in less that 100 milli..

  What is the conditional probability

What is the conditional probability that a student likes gospel music if we know that he or she likes country music?

  Develop estimated regression equations

Develop estimated regression equations, first using annual income as the in- dependent variable and then using household size as the independent variable

  What is the probability

What is the probability

  The random var x has a normal distribution with population m

The random var x has a normal distribution with population mean (u) of 40 and a population variance (q^2) of 36. Find the value of x. Call it x0, such that... A) P (X >= x0) = 0.10 B) P(X =x0) = 0.40

  Compute the price of an Up-and-Out Put option

STATS 237 Project Assignment - The purpose of this question is to compute the price of an Up-and-Out Put option

  What percentage of all possible observed values of x

Explain what the mean, m, tells us about a normal curve. If the random variable x is normally distributed, what percentage of all possible observed values of x will be.

  An initial survey was performed right after médecins sans

An initial survey was performed right after Médecins Sans Frontières accused my brother of wrong doing. Of 1852 customers, 53 were against the aggressive tactics of Médecins Sans Frontières. After my brother was cleared by the court, a follow..

  Quality of the process

Consider the situations and comment on whether the sample results might cause concern about the quality of the process.

Free Assignment Quote

Assured A++ Grade

Get guaranteed satisfaction & time on delivery in every assignment order you paid with us! We ensure premium quality solution document along with free turntin report!

All rights reserved! Copyrights ©2019-2020 ExpertsMind IT Educational Pvt Ltd