Reference no: EM13542121
Part -1:
a) What phase of the business cycle was Italy going through in 2012? Refer to the above sources and economic theory in your answer and demonstrate the phase of the business cycle using an aggregate demand and supply model.
b) Based on the sources above and using your aggregate demand and supply model from a) describe what happened to the Italian economy from 2012 to 2013? Explain your answer with reference to theory.
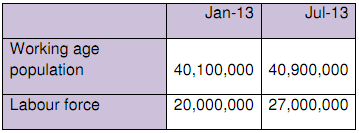
c) What was the unemployment rate in Italy in January 2013 and in July 2013 based on the above graphs? What is the labour force participation rate in Italy in January 2013 and July 2013 according to the below data? What do these statistics tell you how employment in Italy has changed?

Part -2:
1. Explain the characteristics of a monopolistically competitive and oligopoly markets
2. Identify and explain short-run and long-run equilibriums of monopolistic competition
3. Outline the advantages and disadvantages of using advertising to achieve product differentiation
4. Compare monopolistic competition and an oligopoly to a perfectly competitive market in terms of efficiency and price
5. Explain why interdependence in an oligopoly may lead to a kinked demand curve
6. Graph and explain the equilibrium of a dominant firm oligopoly
7. Find and explain the Nash equilibrium/dominant strategy equilibrium in a one-off game
Part -3:
1. Define a government budget and explain its function
2. Describe the difference between discretionary and automatic fiscal policy
3. Understand and show using diagrams how discretionary fiscal policy affects the economy using the AD/AS model
4. Analyse and describe what type of fiscal policy is suitable given different states of the economy (i.e. phases of the business cycle)
5. Describe how automatic stabilisers/ automatic fiscal policy works
6. Interpret and comment on the effect of the 2014 budget on the economy with reference to theory.
Part -4:
1. Define a government budget and explain its function
2. Describe the difference between discretionary and automatic fiscal policy
3. Understand and show using diagrams how discretionary fiscal policy affects the economy using the AD/AS model
4. Analyse and describe what type of fiscal policy is suitable given different states of the economy (i.e. phases of the business cycle)
5. Describe how automatic stabilisers/ automatic fiscal policy works
6. Interpret and comment on the effect of the 2014 budget on the economy with reference to theory.
Part -5
1. Draw and explain the AD/ AS model
2. Define AD and explain why it slopes downward
3. Identify the factors that shift AD (AD= C+I+G+(X-M)) and apply this to real-life scenarios
4. Define SAS and explain the factors that shift SAS
5. Draw and explain the short-run macroeconomics equilibrium and demonstrate with the aid of graphs and explanations how shifts in AD and SAS affect the equilibrium
Part -6
1. Explain and calculate Price Elasticity of Demand (PED) using:
• Midpoint formula
• Total Revenue Test
2. Explain what determines the PED for a certain good
3. Draw elastic, inelastic, perfectly inelastic and elastic demand curves and show how elasticity of demand affects a market where curves shift
4. Calculate and interpret cross elasticity of demand (CED)
5. Calculate and interpret income elasticity of demand (IED)
6. Explain and calculate Price Elasticity of Supply (PES)
7. Explain what determines the PES for a certain good
8. Draw elastic, inelastic, perfectly inelastic and elastic supply curves and show how elasticity of supply affects a market where curves shift