What percentage had coronary heart disease

Assignment Help Basic Statistics
Reference no: EM131730074

Question: Exercises I and II presented data on grumpy old men and heart disease. In Chapter 4, the goal was to determine if there was a relationship between the two variables. A one tailed test may also make sense. We might hypothesize that if there is a difference in the probability of developing heart disease for men with no anger and men with lots of anger, the latter group would have a higher probability. Minitab output for testing this claim follows. Note that p1 is the probability of developing heart disease for men with no anger and p2 is the probability of developing heart disease for men with the most anger.

803_Sample 1.png

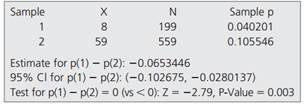
a. Write the null and alternative hypotheses in terms of p1 and p2, taking into account the claim being tested.

b. What is the value of the test statistic?

c. What conclusion would you reach using level of significance a = .01? Write your conclusion in statistical terms and in the context of the problem.

Exercises II: Exercise I concerned the relationship between anger and the risk of coronary heart disease. Some computer output for a chi-square test is shown below. What do the results indicate about the relationship? Explain.

142_Sample 2.png

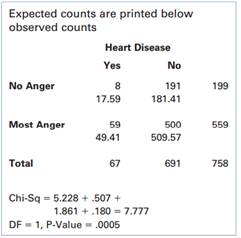
Exercise I: Do grumpy old men have a greater risk of having coronary heart disease than men who aren't so grumpy? Harvard Medical School researchers examined this question in a prospective observational study reported in the November 1994 issue of Circulation (Kawachi et al., 1994). For 7 years, the researchers studied men between the ages of 46 and 90. All study participants completed a survey of anger symptoms at the beginning of the study period. Among 199 men who had no anger symptoms, there were 8 cases of coronary heart disease. Among 559 men who had the most anger symptoms, there were 59 cases of coronary heart disease.

a. Construct a contingency table for the relationship between degree of anger and the incidence of heart disease.

b. Among those with no anger symptoms, what percentage had coronary heart disease?

c. Among those with the most anger symptoms, what percentage had coronary heart disease?

d. Draw a bar graph of these data. Based on this graph, does there appear to be an association between anger and the risk of coronary heart disease? Explain.

Reference no: EM131730074

Questions Cloud

Alternative measures of well-being : Can poorer countries do well on these alternative measures of well-being? Could people be misled about differences in living standards.
Prepare the journal entries for the transactions : Purchased merchandise on account from Hamling Co., list price $72,000, trade discount 15%, Prepare the journal entries for the above transactions
Calculate the consumption-production : How do you calculate the consumption, production, and terms of trade effect?
Write an argument essay about ny attack : Write an argument essay about NY attack that happened a few weeks ago at Hudson River bike path in the area of lower Manhattan.
What percentage had coronary heart disease : Exercises I and II presented data on grumpy old men and heart disease. In Chapter 4, the goal was to determine if there was a relationship between.
What about the third party selling the data : The Privacy Act of 1974 prohibits the US government from storing many types of data about its citizens. What about the third party selling the data?
Key facts about short-run economic fluctuations : Identify Coca-Cola key facts about short-run economic fluctuations and how the economy in the short run differs from the economy in the long run.
What are some key intellectual properties : What are some key intellectual properties (patents, copyrights) that Amazon owns?
Prepare the compound general journal entry for the payment : Use this information to prepare the compound General Journal entry (without explanation) for the payment of the note on June 30, 2017

Reviews

Write a Review

Basic Statistics Questions & Answers

  State whether number 621 is a parameter or a statistic

An opinion poll uses random digit dialing equipment to dial 2000 randomly chosen residential telephone numbers. Of these, 621are unlisted numbers. State whether number 621 is a parameter or a statistic. State whether number 35% is a parameter or a ..

  What is the number of degrees of freedom

But, wait.  What if MSF actually does not know the population standard deviation? Then we should compute the t-statistic for our analysis. Compute the t-statistic using xbar, µ, s, and n. What is the number of degrees of freedom df

  Confidence interval for mean daily income of parking garage

What assumptions must you make in order to use these statistics for inference? Explain in context what this confidence interval means.

  Compute the correlation coefficient for the data

compute the correlation coefficient for the data belowx values -5 -1 1 2y values 3 -1 -3 3a 0.641b 0.453c - 0.411d -

  Find the proportion of the observations

Computing probability values using normal distribution - Find the proportion of the observations will fall in the interval from 40 to 60?

  Are these data consistent with the hypothesis

Are these data consistent with the hypothesis that a vacuum tube's lifetime is exponentially distributed with a mean of 50 hours?

  What height divides tallest percent of population from rest

The mean height of American women aged 20-29 is 64.2 inches, with a standard deviation of 2.5 inches (Statistical Abstract of the United States: 2009, 2008).

  Anova for rating of cruise ships

The following data shows the service ratings for eight ramdomly selected small ships, eight randomly selected large ships. All ships are rated on a 100-point scale, with higher valuse indicated better service (traveler Feb 2003)

  South african bureau of standards

Milk cartons are advertised to contain one litre of milk. From a random sample of 18 one-litre cartons whose contents were accurately measured by the South African Bureau of Standards (SABS), it was found that the average fill was 0.981 l with a s..

  Conclude that joining weight reducers on average will lose

At the .05 level of significance, can we conclude that those joining Weight Reducers on average will lose less than 10 pounds? Determine the p-value.

  Compute the sample correlation coefficient

Construct a scatter plot of these data. Describe the relationship between the variables x and y.- Compute the sample correlation coefficient. Interpret this value.

  T give a 999 confidence interval for a population mean

to give a 99.9 confidence interval for a population mean ? you would use the critical valuea.z 2.576.b.z 1.960.c.z

Free Assignment Quote

Assured A++ Grade

Get guaranteed satisfaction & time on delivery in every assignment order you paid with us! We ensure premium quality solution document along with free turntin report!

All rights reserved! Copyrights ©2019-2020 ExpertsMind IT Educational Pvt Ltd