Reference no: EM13786935
Part -1:
In 1974, Vanguard World Xpress was founded by Yanos Zarkov, a second generation immigrant from Eastern Europe. The company produces custom crates, boxes, and other packaging materials that are used by exporters of delicate scientific devices. The success of the company is the result of a commitment to quality and service to the customer. Recently, it has become more difficult for Yanos to provide dependable service while, at the same time, containing costs.
One of the tradeoffs faced by VWX is between inventory costs and production backlogs. Inventory costs result from the storage of raw and finished packaging materials. Production backlogs occur if there is not sufficient inventory to fill an order, and they result in unsatisfied customers. Yanos feels that accurate demand forecasts would allow the company to contain inventory costs and eliminate production backlogs.
The local university recently instituted an intern program, so Yanos contacted the director of the program and agreed to hire a student. It turns out to be you. He asks his accountant to obtain accurate quarterly sales data for the past three years, in millions of dollars, and hands it to you. The data are listed below. With the guidance of your crusty old economics adviser you begin to develop a forecasting model for VWX. Your adviser's recommendations are given as Problems 1 through 6 below.
|
Period
|
1990.1
|
1990.2
|
1990.3
|
1990.4
|
1991.1
|
1991.2
|
|
Sales
|
6.2
|
8.6
|
8.8
|
9
|
5.2
|
10
|
|
Period
|
1991.3
|
1991.4
|
1992.1
|
1992.2
|
1992.3
|
1992.4
|
|
Sales
|
12.8
|
12.4
|
9.4
|
14.9
|
13.8
|
13.9
|
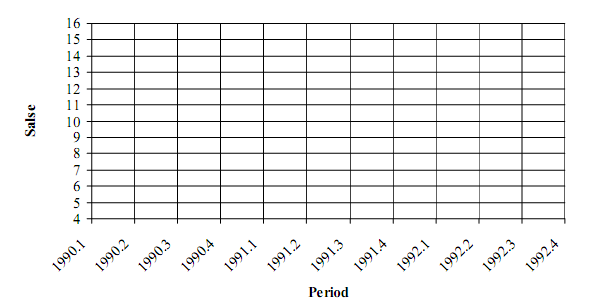
1. Plot the data on the graph below. Do you see evidence of a secular trend? Seasonal variation? Cyclical variation? Comment on each of these time-series components and on the methods that can be used to estimate them.

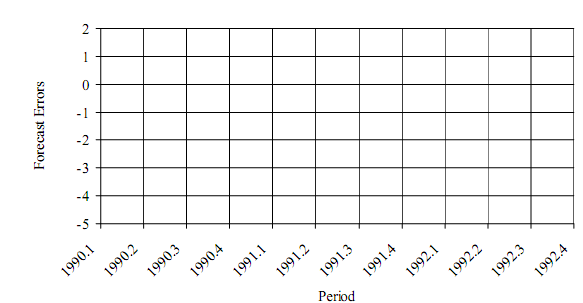
2. Estimate the linear trend using regression analysis. Use the estimated trend equation to fill in the blanks in the table that follows. Note that A is the actual value and F is the forecast value of sales. Plot a line based on the forecast values of sales on the graph for Problem 1. Plot the forecast errors (A-F) on the graph below. What time-series components give rise to these forecast errors? Calculate the RMSE and comment on the accuracy of the forecasts that are derived using this method. Can the RMSE be calculated directly from the regression output?
|
Period
|
Trend
|
Sales (A)
|
Sales (F)
|
(A-F)
|
(A-F)2
|
|
1990.1
|
1
|
6.2
|
|
|
|
|
1990.2
|
2
|
8.6
|
|
|
|
|
1990.3
|
|
8.8
|
|
|
|
|
1990.4
|
4
|
9
|
|
|
|
|
1991
|
|
5.2
|
|
|
|
|
1991.2
|
6
|
10
|
|
|
|
|
1991.3
|
|
::
|
|
|
|
|
1991.4
|
|
:_' 4
|
|
|
|
|
1992.1
|
9
|
9.-4
|
|
|
|
|
1992.2
|
? )
|
-4.9
|
|
|
|
|
1992.3
|
|
?.x
|
|
|
|
|
1992.4
|
12
|
i 3.9
|
|
|
|

3. Estimate the log-linear trend using regression analysis. Calculate the growth rate that is implied by the estimated slope coefficient. Use the log-linear trend equation to fill in the blanks in the table that follows. Note that lnF is the forecast natural logarithm of sales and the F is the antilog of this value. Calculate the RMSE and comment on the accuracy of the forecasts yielded by this method. Can the RMSE be calculated directly from the regression output? Compare these forecasts with the ones you calculated for Problem 2.
|
Period
|
Sales (A)
|
Sales (InF)
|
Sales (F)
|
(A-F)
|
(A-F)2
|
|
1990.1
|
6.2
|
|
|
|
|
|
1990.2
|
8.6
|
|
|
|
|
|
1990.3
|
8.8
|
|
|
|
|
|
1990.4
|
9
|
|
|
|
|
|
1991.1
|
5.2
|
|
|
|
|
|
1991.2
|
10
|
|
|
|
|
|
1991.3
|
12.8
|
|
|
|
|
|
1991.4
|
12.4
|
|
|
|
|
|
1992.1
|
9.4
|
|
|
|
|
|
1992.2
|
14.9
|
|
|
|
|
|
1992.3
|
13.8
|
|
|
|
|
|
1992.4
|
13.9
|
|
|
|
|
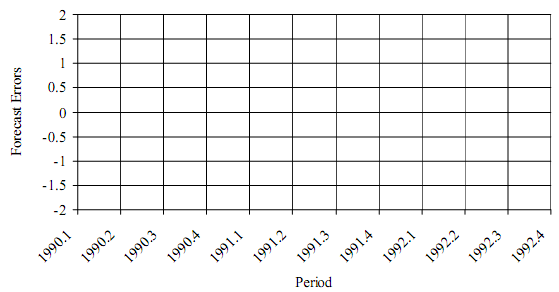
4. Estimate a seasonally adjusted linear trend equation using regression analysis with dummy variables. Use the equation to fill in the blanks in the table below. Plot the forecast errors on the graph that follows. Compare this graph with that from Problem 2. Calculate the RMSE and comment on the accuracy of the forecasts yielded by this method. Compare these forecasts with those you calculated previously.
|
Period
|
Trend
|
Sales (A)
|
Sales (F)
|
(A-F)
|
(A-F)2
|
|
1990.1
|
1
|
6.2
|
|
|
|
|
1990.2
|
|
8.6
|
|
|
|
|
1990.3
|
|
8.8
|
|
|
|
|
1990.4
|
-4
|
9
|
|
|
|
|
1991.1
|
5
|
|
|
|
|
|
1991.2
|
r
|
1
|
|
|
|
|
1991.3
|
|
::
|
|
|
|
|
1991.4
|
x
|
:_' -4
|
|
|
|
|
1992.1
|
9
|
9.-4
|
|
|
|
|
1992.2
|
10
|
.4 .9
|
|
|
|
|
1992.3
|
11
|
13.8
|
|
|
|
|
1992.4
|
|
13.9
|
|
|
|

5. Use the trend equation that was estimated in Problem 2 to calculate ratio-to-trend seasonal adjustment factors. Fill in the blanks in the table below. Note that (A/F) is actual sales divided by the trend forecast and SF is the seasonally adjusted trend forecast. Calculate the RMSE. Comment on the accuracy of the forecasts yielded by this method and compare them with the forecasts you calculated previously.
|
Period
|
Sales (A
|
Sales (F)
|
(A/F)
|
(SF)
|
(A-SF)2
|
|
1990.1
|
6.2
|
|
|
|
|
|
1990.2
|
8.6
|
|
|
|
|
|
1990.3
|
8.8
|
|
|
|
|
|
1990.4
|
9
|
|
|
|
|
|
1991.1
|
5.2
|
|
|
|
|
|
1991.2
|
10
|
|
|
|
|
|
1991.3
|
.1'.
|
|
|
|
|
|
1991.4
|
12.4
|
|
|
|
|
|
1992.1
|
9.4
|
|
|
|
|
|
1992.2
|
14.9
|
|
|
|
|
|
1992.3
|
13.8
|
|
|
|
|
|
1992.4
|
13.9
|
|
|
|
|
6. Enter the RMSE and the forecasts for the next four quarters into the table below for each of the four forecasting models estimated in this problem. Use the information in the table to compare the models. Which would you recommend to Yanos Zarkov?
|
Model
|
Linear Trend
|
Constant
Growth Rate
|
Seasonal
Dummy
Variables
|
Ratio-To-
Trend
|
|
RMSE
|
|
|
|
|
|
1993.1
|
|
|
|
|
|
1993.2
|
|
|
|
|
|
1993.3
|
|
|
|
|
|
1993.4
|
|
|
|
|
Part -2:
Arizona Crystal is a distributor of feldspar, amethyst and other mystically powerful types of crystals. The owner of Arizona Crystal, Geri Moonbeam, is proud to be a part of the movement that is contributing to the higher spirituality of the world. Geri buys crystals from local collectors and then ships them out to wholesalers throughout the country. Geri pays cash for the crystals, but she extends credit to the wholesalers.
As the business has grown, problems have arisen. When Geri buys more crystals than she can sell, inventory increases and cash flow problems arise. When Geri doesn't buy enough crystals, then she can't fill orders and that creates problems with her customers. She needs to base her buying decisions on accurate forecasts of the demand for crystals so she can avoid these problems.
After consulting her tarot cards, Geri visits a friend from El Paso, Texas, who channels for a Wall Street tycoon who didn't survive the crash of 1929. He recommends that, since she only has twelve months of data, she should try using a moving average or exponential smoothing forecasting model. So Geri contacts you. She provides you with data on the number of crystals (in thousands) ordered during each of the past twelve months and asks you to help her develop a forecasting model. To do so, solve Problems 7 through 11 below.
7. Use a three period moving average model to forecast the demand in January of 1993. Also calculate the RMSE for this model. Use the table below.
|
Month
|
Demand (A)
|
Demand (F)
|
(A-F)2
|
|
Jan-92
|
25.6
|
|
|
|
Feb-92
|
24.7
|
|
|
|
Mar-92
|
2 1 .3
|
|
|
|
Apr-92
|
13.9
|
|
|
|
May-92
|
12.6
|
|
|
|
Jun-92
|
18.0
|
|
|
|
Jul-92
|
21.5 |
|
|
|
Aug-92
|
22.3 |
|
|
|
Sep-92
|
30.7 |
|
|
|
Oct-92
|
15.0
|
|
|
|
Nov-92
|
13.8 |
|
|
|
Dec-92
|
22.6 |
|
|
8. Use a five period moving average model to forecast the demand in January of 1993. Also calculate the RMSE for this model. Use the table below to carry out your calculations. How does this model compare with the three period model?
|
Month
|
Demand (A)
|
Demand (F)
|
(A-F)2
|
|
Jan-92
|
25.6
|
|
|
|
Feb-92
|
24.7
|
|
|
|
Mar-92
|
2 1 .3
|
|
|
|
Apr-92
|
13.9
|
|
|
|
May-92
|
12.6
|
|
|
|
Jun-92
|
18.0
|
|
|
|
Jul-92
|
21.5 |
|
|
|
Aug-92
|
22.3 |
|
|
|
Sep-92
|
30.7 |
|
|
|
Oct-92
|
15.0
|
|
|
|
Nov-92
|
13.8 |
|
|
|
Dec-92
|
22.6 |
|
|
9. Use an exponential smoothing model with a weight of 0.6 to forecast demand in January of 1993. Also calculate the RMSE for this model. Use the mean value of 20.2 as your initial estimate. Use the table below to carry out your calculations. How does this model compare with the moving average models?
|
Month
|
Demand (A)
|
Demand (F)
|
(A-F)2
|
|
Jan-92
|
25.6
|
|
|
|
Feb-92
|
24.7
|
|
|
|
Mar-92
|
2 1 .3
|
|
|
|
Apr-92
|
13.9
|
|
|
|
May-92
|
12.6
|
|
|
|
Jun-92
|
18.0
|
|
|
|
Jul-92
|
21.5 |
|
|
|
Aug-92
|
22.3 |
|
|
|
Sep-92
|
30.7 |
|
|
|
Oct-92
|
15.0
|
|
|
|
Nov-92
|
13.8 |
|
|
|
Dec-92
|
22.6 |
|
|
10. Use an exponential smoothing model with a weight of 0.1 to forecast the demand in January of 1993. Also calculate the RMSE for this model. Use the mean value of 20.2 as your initial estimate. Use the table below to carry out your calculations. How does this model compare with the moving average models and with the previously estimated moving average model?
|
Month
|
Demand (A)
|
Demand (F)
|
(A-F)2
|
|
Jan-92
|
25.6
|
|
|
|
Feb-92
|
24.7
|
|
|
|
Mar-92
|
2 1 .3
|
|
|
|
Apr-92
|
13.9
|
|
|
|
May-92
|
12.6
|
|
|
|
Jun-92
|
18.0
|
|
|
|
Jul-92
|
21.5 |
|
|
|
Aug-92
|
22.3 |
|
|
|
Sep-92
|
30.7 |
|
|
|
Oct-92
|
15.0
|
|
|
|
Nov-92
|
13.8 |
|
|
|
Dec-92
|
22.6 |
|
|
11. Recall that the degree of smoothing associated with a moving average model is a function of the number of periods used to calculate the average. Recall also that the degree of smoothing associated with an exponential smoothing model is a function of the weight used to calculate the estimate. What is the moving average forecast of demand for January of 1993 when the maximum possible smoothing is applied? What is the exponential smoothing forecast for January of 1993 when the maximum possible smoothing is applied? What is the weight used to obtain the maximum possible smoothing? Use this weight to fill in the table below and calculate the RMSE. What is your conclusion regarding the best forecasting model?
|
Month
|
Demand (A)
|
Demand (F)
|
(A-F)2
|
|
Jan-92
|
25.6
|
|
|
|
Feb-92
|
24.7
|
|
|
|
Mar-92
|
2 1 .3
|
|
|
|
Apr-92
|
13.9
|
|
|
|
May-92
|
12.6
|
|
|
|
Jun-92
|
18.0
|
|
|
|
Jul-92
|
21.5 |
|
|
|
Aug-92
|
22.3 |
|
|
|
Sep-92
|
30.7 |
|
|
|
Oct-92
|
15.0
|
|
|
|
Nov-92
|
13.8 |
|
|
|
Dec-92
|
22.6 |
|
|
12. Continuing in the same vein as Problem 11, what is the moving average forecast of demand for January of 1993 when the minimum possible smoothing is applied? What is the exponential smoothing forecast for January of 1993 when the minimum possible smoothing is applied? What is the weight used to obtain the minimum possible smoothing? Use this weight to fill in the table below and calculate the RMSE. Now what is your conclusion regarding the best forecasting model?
|
Month
|
Demand (A)
|
Demand (F)
|
(A-F)2
|
|
Jan-92
|
25.6
|
|
|
|
Feb-92
|
24.7
|
|
|
|
Mar-92
|
2 1 .3
|
|
|
|
Apr-92
|
13.9
|
|
|
|
May-92
|
12.6
|
|
|
|
Jun-92
|
18.0
|
|
|
|
Jul-92
|
21.5 |
|
|
|
Aug-92
|
22.3 |
|
|
|
Sep-92
|
30.7 |
|
|
|
Oct-92
|
15.0
|
|
|
|
Nov-92
|
13.8 |
|
|
|
Dec-92
|
22.6 |
|
|
Part -3:
The Ice Cream Council is an industry group that is funded by contributions by ice cream manufacturers. It engages in advertising and public relations on behalf of the ice cream industry. The Council wants to determine the effect of its advertising expenditures on the market for ice cream. It devises the following three-equation econometric model of the market for ice cream.
(1) QSt = S0 + S1 Pt
(2) QDt = D0 - D1 Pt + D2 At
(3) QSt = QDt
QSt and QDt are the quantities supplied and demanded of ice cream in month t, Pt is the price per gallon of ice cream in month t, At is advertising expenditure in millions of dollars by the Council in month t, and S0, S1, D0, D1, and D2 are parameters to be estimated. Equations 1 and 2 are structural equations that define the supply and demand for ice cream, respectively, and Equation 3 defines the condition for market equilibrium.
Regression analysis is used to estimate the two behavioral equations. The results are given below.
(1) QSt = 5 + 15 Pt
(2') QDt = 45 - 5Pt + At
13. Derive the reduced form equation for Qt (which is equal to the equilibrium values of both QS and QD at time t) and for Pt, the two endogenous variables in the model. Use Equations 1, 2, and 3. Note that At is an exogenous variable that is determined by the actions of the Ice Cream Council.
14. Use the information in Equations 1' and 2' to forecast price, quantity sold, and total industry revenue before and after an increase in advertising expenditures from $4 to $10 million. Is this increase in advertising expenditures appropriate?
15. The table that follows presents data on four leading indicators for a four month period. Construct a composite index with each indicator assigned equal weight. Next, construct a composite index with the first indicator assigned a weight of 0.40 and the remaining indicators assigned a weights of 0.20. Finally, construct the diffusion index. Compare the implications of the three indexes over the four month period.
|
Month
|
Indicator 1
|
Indicator 2
|
Indicator 3
|
Indicator 4
|
|
Jan-92
|
100
|
40
|
I5
|
97
|
|
Feb-92
|
120
|
50
|
I3
|
65
|
|
Mar-92
|
150
|
40
|
I _
|
69
|
|
Apr-92
|
130
|
40
|
I 5
|
65
|