Reference no: EM132582828
Question 1: Theoil wildcatter in Chapter 4 hires a geological survey firm to test a piece of land that is believed to have a 40% chance of containing oil. Based on a long history of using a particular test methodology, the firm has a pretty good track record: in land that actually contains oil, their test reports -oil? 82% of the time, and in land that actually contains no oil, their test repots -no oil? 94% of the time.a)Create a complete table of probabilities (joint and marginal)b)Create a tree of probabilities (conditional and joint)c)If the test says -oil,? what is the probability that oil actually exists?d)How sensitive are the test results to the prior belief of 40% chance of oil? Explain
Question 2: client has asked for yourassessment of how long it will take your teamto finishimplementing anenterprise software project. There are a number of factors over
which you have no control, so rather than give a single point estimate, you assess the probability of the various outcomes you believe are possible.
a) What is the expected value of the number of weeks that will be required to complete the project?
b) What is the standard deviation of the number of weeks required?
Question 3: Figure 7-75shows the density and cumulative distribution for a company's beliefs about its net income for the coming year (US$ millions). Based only on your best interpretations of these diagrams:
a)Give a summary description of the distribution, as if over a telephone or in text messages.
b)What is your best guess of the median? Mode? Mean?
c)What is your best guess of the standard deviation?d)What is the approximate probability that net income will fall below 20?
e)What is the approximate probabilitythat net income will fall between 15 and 20?
f)Approximately where does the middle 50% lie?
g)Approximately where do the 5% tails begin?
h)For each of these questions, which diagram -density or cumulative -was more helpful? Why?
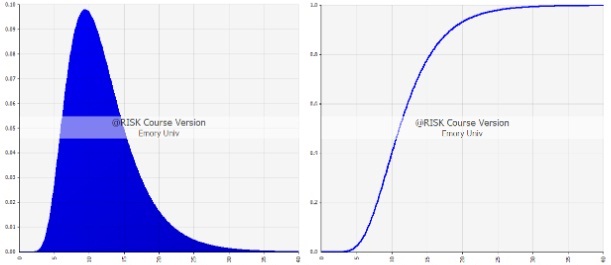
Figure 7-75 Probability distribution of coming year's net income (US$ millions)