Reference no: EM13961429
QUESTIONS - Monte Carlo Simulation: Sanjay's Restaurant
After years of working in management consulting, Fuqua alum Sanjay wants to return to Durham and open a gourmet Indian restaurant. Cooking has always been Sanjay's passion and he believes the growing Durham (and Research Triangle) market would truly appreciate fine Indian cuisine. The extensive travel associated with Sanjay's consulting job has given him the opportunity to study gourmet Indian restaurants in many U.S. cities and, whenever possible, he talked to the managers to better understand the profitability of their operations.
Sanjay has developed a pro--forma monthly cash flow analysis, which is shown in Exhibit 1.
Exhibit 1: Pro forma Cash Flow Analysis
Monthly Cash Flows
|
Number of Customers
|
2400
|
|
|
Average Sales
|
$25.00
|
per customer
|
|
Direct Cost of Sales
|
$7.00
|
per customer
|
|
Gross Margin
|
$43,200
|
=(Number of customers)*(Average Sales - Direct Cost)
|
|
Payroll (including taxes)
|
$24,000
|
|
|
Other Fixed Costs
|
$8,000
|
|
|
Total Operating Expenses
|
$32,000
|
= (Payroll)+ (Other Fixed Cists)
|
|
Profit (before Taxes)
|
$11,200
|
=(Gross Margin)-(Total Operating Expenses)
|
Unfortunately, just about every number in this analysis is uncertain. Sanjay wants to build a Monte Carlo simulation model to better understand the risks of this venture.
From his conversations with restaurant owners in other cities, Sanjay estimates probability distributions for the variables as follows:
• Number of customers per month: This is very hard to predict. Sanjay is optimistic about the demand but recognizes the uncertainty and assigns a lognormal distribution with mean 2,400 and standard deviation 800 (and "location" parameter equal to zero).
• Average sales per customer: Sanjay's prices will be set according to his estimate of what customers will pay. At this point, he is uncertain about the average sales per customer and assigns a normal distribution with a mean of $25.00 per customer and a standard deviation of $4.00.
• Direct cost of sales: This includes the costs of food served to customers as well as other incidental expenses (e.g., laundry). Sanjay assigns a normal distribution with a mean of
$7.00 per customer with a standard deviation of $1.00.
• Payroll costs. Sanjay assigns a triangular distribution with a most likely value of $24,000 per month and a minimum value of $19,000 and a maximum of $32,000.
• Other fixed costs: Sanjay has identified a location in Durham and estimates that rent, utilities, and insurance for the location will cost about $8,000 dollars per month. He is quite confident about this and does not feel the need to model it as uncertain.
Some of these uncertainties are correlated. Specifically:
• Food with more expensive ingredients will typically be sold at higher prices. Sanjay estimates that the average sales per customer and direct costs of sales per customer are positively correlated with a correlation of 0.6.
• The payroll costs will tend to vary with the number of customers: if you have more customers, you need more staff members to serve them. Sanjay estimates that the number of customers and payroll expenses are positively correlated with a correlation of 0.4.
Build a simulation model of this venture to answer the following questions. Please run at least 10,000 trials for your final reported results. (Recall that Crystal Ball sometimes runs extremely slowly when in Extreme Speed. If this happens, run your model in Normal Speed instead.)
Important: Provide appropriate supporting Crystal Ball charts/statistics next to your answer to each question.
1. Build a deterministic model (without probability distributions) using the values shown in the pro forma cash flow statement but separate the inputs from the calculations. Make a copy of your deterministic model and, for this question only, change the number of customers from 2400 to 2500 and the average sales from $25 to $28. What is the profit?
Proceed to add probabilistic details in the copy of your deterministic model with the original value of 2400 customers and $25 average sales.
2. Define Crystal Ball assumptions as described but do NOT define the correlations.
a. What is the average profit per month?
b. What are the 10th and 90th percentiles of profit per month?
3. Add the correlations to your Crystal Ball assumptions.
a. What is the average profit per month?
b. What are the 10th and 90th percentiles of profit per month?
4. What is the probability that Sanjay's profit exceeds $10,000 per month with this venture?
5. Compare the statistics and risk profiles (i.e., probability distributions on profits) for the three locations. Prepare an overlay chart containing the profit distribution for each location.
a. What is the mean profit for each location?
b. Which outcome has the least profit variability?
c. Can you rule out any of the locations at this time? Explain by referring to the Cumulative Frequency overlay chart view.
6. The most important assumption in Sanjay's model is the assumption about the mean number of potential customers: he has assumed that the number of potential customers is lognormally distributed with a mean of 2,400 and a standard deviation of 800. Assuming Sanjay is risk neutral, we want to understand how the choice of location for the restaurant (between locations A, B, and C above) changes if we vary the mean number of potential customers away from the assumed value of 2,400. You may assume that the standard deviation and correlations remain the same as this mean changes.
a. Construct a data table and corresponding chart showing how the expected value of profit for these three alternatives change as we vary the mean for the number of potential customers between 1,000 and 5,000 customers per month (with increments of 250 customers).
b. What is the preferred location and average profit for mean demand of 2,000 customers? 3,500 customers? 4,500 customers?
c. Identify the customer levels in your data table at which the preferred location changes (if it changes) between a mean number of potential customers of 1,000 and 5,000. (Note: You do not need to interpolate to find exact transition points. Report the number of customers in your data table for each transition to a new location with the highest average profit.)
Monte Carlo Simulation: Sanjay's Restaurant
On his frequent trips to Washington D.C., Sanjay became acquainted with Vasu Purohit, the owner of a fine Indian restaurant there. As it turns out, Vasu's son Debu lives in Durham and Vasu has contemplated selling his restaurant in D.C. and moving to Durham to be closer to Debu and his family. Vasu and Sanjay have discussed forming a partnership to open the restaurant in Durham. Sanjay believes that Vasu's experience would increase the likelihood that the restaurant will be successful. Specifically, Sanjay believes that Vasu's experience will increase the mean of the monthly demand distribution (= number of potential customers) from 2,400 to 2,800; the distribution remains lognormally distributed with a standard deviation of 800 and the correlation between the number of customers and payroll costs remains unchanged. All of the other assumptions and correlations also remain the same.
In the arrangement they have discussed, Vasu would be paid a fixed management fee of $3,000 per month plus a bonus of 50% of any monthly profits (before taxes) above $9,000. ("Profits" here refers to the original profit before any payment to Vasu.) For example, in the scenario shown in Exhibit 1, Vasu would receive $3,000 + 0.5*($11,200--$9,000) = $4,100 that month. By contrast, in any month when the profit is less than $9,000, Vasu will only receive the fixed fee of $3,000.
For this analysis, assume that the restaurant will be in location A.
7. Build a simulation model to study Sanjay's earnings if he teams with Vasu.
a. What is Sanjay's expected monthly profit, under the arrangement with Vasu?
b. What is the probability that Vasu will receive any bonus payment?
c. Prepare an overlay chart comparing Sanjay's profit with and without Vasu. What is the impact on Sanjay's average profit and profit variability of partnering with Vasu?
8. Suppose Sanjay is risk averse and has an exponential utility function for monthly profits, with a risk tolerance of $100,000.
a. What are Sanjay's certainty equivalents with and without Vasu?
b. Assuming that Sanjay's goal is to maximize his certainty equivalent, should Sanjay take on Vasu as a partner or pursue the venture alone?
III. Decision Tree: John Barleycorn
John Barleycorn was a wheat farmer in the Palouse Plateau of Eastern Washington. The Palouse Plateau is a naturally dry region, which makes it a difficult and risky place to grow wheat.
However, with careful management of moisture levels and a bit of rain, farmers in this region can grow a nice crop. Barleycorn recently passed away and his son, John Barleycorn, Junior (aka "Junior") is trying to figure out what to do with the winter growing season as he manages his father's estate.
Barleycorn's farm traditionally planted winter wheat that will be harvested in the late spring. If he grows the crop this season, there are two things that are uncertain: Barleycorn does not know how much wheat he will harvest and he does not know the price he will be paid for his wheat. It will cost $400,000 to plant the wheat and manage it until harvest time.
The size of Barleycorn's crop depends on the weather in the Palouse Plateau. We can distinguish between the weather in the winter and the weather in the early spring. In each season, the weather will either be wet or dry, with the probabilities shown in Figure 1 below. The best weather for Barleycorn's crop would be a wet winter followed by a dry spring. In this case, he will grow 150,000 bushels of wheat. If the weather is dry in both seasons, Barleycorn's crop will only be 75,000 bushels. The cases where it is dry and then wet or wet in both seasons have crop yields between these two extremes, as shown in Figure 1.
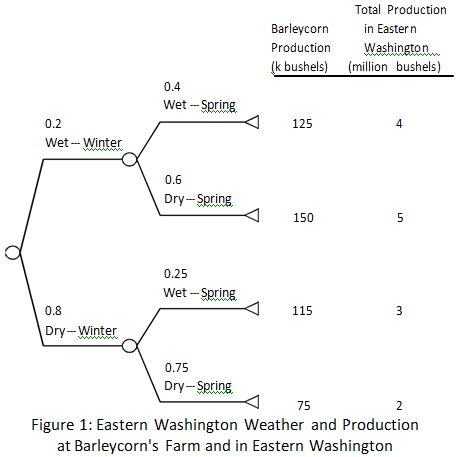
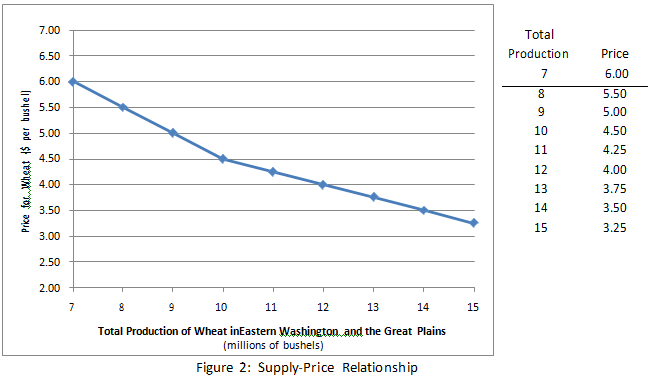
The price of wheat at harvest will be determined by the total production of wheat from two regions, Eastern Washington (where Barleycorn's farm is located) and the Great Plains region. The total production of wheat in Eastern Washington depends on the weather in Eastern Washington. These total production figures for Eastern Washington are noted in Figure 1. The production in the Great Plains depends on what farmers in the Great Plains decide to do and the weather there. The total production in the Great Plains will either be 6 or 8 million bushels, with probabilities 0.7 and 0.3, respectively. The production in the Great Plains is independent of the production and weather in Eastern Washington. The relationship between the total production of wheat and the market price for the wheat is shown in Figure 2.
Junior Barleycorn has been approached by a neighboring farmer, Steve Winwood, who offered to manage the Barleycorn farm for the winter season. Winwood asks Barleycorn to contribute
$65,000 towards the cost of growing the crop in exchange for giving Barleycorn 25% of the total revenue generated; Winwood would pay the rest of the cost of growing the crop and keep 75% of the revenue generated.
Junior Barleycorn is wondering whether or not he should accept Winwood's proposal.
QUESTIONS
1. Create a decision tree and calculate the expected profit associated with planting and harvesting Barleycorn's crop, with and without Winwood's proposal. Assuming Barleycorn is risk neutral, should Junior accept Winwood's proposal?
2. Is Barleycorn's decision to accept or reject Winwood's proposal sensitive to the probability of having the high supply (8 million bushels) in the Great Plains? If so, create a table and chart to show how Barleycorn's expected value and decision changes as this probability changes. What is the probability at which Barleycorn is indifferent between going alone and accepting Winwood's offer? (Assume Barleycorn is risk neutral, as in Question 1.)
3. Given that the size of the crop is so sensitive to the weather, Junior Barleycorn is interested in perhaps obtaining better weather forecasts. Before considering these forecasts in detail, he wants to know how much perfect information about the weather would be worth. Specifically, he wants to know:
a. How much is perfect information about just the winter weather worth?
b. How much is perfect information about both the winter and spring weather worth?
c. How much is perfect information about just the spring weather worth?
In all cases, assume that Barleycorn is risk neutral and that the perfect information about the weather would be available before Barleycorn has to decide on Winwood's proposal.
4. Of course, Junior Barleycorn is not risk neutral. Suppose Barleycorn has an exponential utility function with a risk tolerance of $300,000.
a. Given Barleycorn's risk aversion, should he accept Winwood's proposal?
b. What are the certainty equivalents of the crop with and without Winwood's proposal?
c. At what risk tolerance, if any, would Barleycorn be just indifferent to accepting or rejecting Winwood's proposal?
5. Winwood's proposal reduces the risks for Barleycorn. However, Junior Barleycorn could also hedge his risks by selling some or all of his wheat "forward" at the forward price of $5.00 per bushel rather than taking a chance on what the price will be when it is harvested.
For example, suppose Barleycorn sells 100,000 bushels of wheat forward. If Barleycorn harvests 150,000 bushels of wheat, 100,000 bushels will go to meet his forward obligation and the other 50,000 bushels will be sold at the market price that prevails at harvest time. If this market price turns out to be, say, $4.00, Barleycorn will net
$5.00×100,000 + $4.00×50,000 = $700,000 in this scenario.
As another example, suppose Barleycorn sells 150,000 bushels of wheat forward. If his harvest turns out to be only 100,000 bushels, then, to meet his forward obligation, Barleycorn will have to obtain another 50,000 bushels by buying them at the then-- prevailing market price. If the market price turns out to be $4.00, then Barleycorn will net $5.00×150,000 -- $4.00×50,000 = $550,000. (Note the minus sign here!) Barleycorn can sell any amount of wheat forward he desires; he can even sell negative amounts forward if he wants (i.e., by promising to buy wheat at harvest time).
Keep in mind that Barleycorn's hedging activity does not involve Winwood. In any deal with Winwood, Barleycorn receives 25% of actual crop production revenue sold at market prices. Selling wheat forward is a side transaction by Barleycorn alone.
Suppose Barleycorn is risk averse and uses an exponential utility function with a risk tolerance of $300,000.
a. Should he sell any wheat forward?
b. Is so, how much should he sell forward if he rejects Winwood's proposal and goes it alone?
c. How much should he sell forward if he accepts Winwood's proposal?
d. Taking into account these hedging opportunities, should Barleycorn accept Winwood's proposal?
Optimization: DayJets
Background. A growing number of executives and elite travelers have given up on commercial air travel and rely on privately owned aircraft instead. Private jets can save travelers a significant amount of time while providing comfort, convenience and privacy. Though it is quite expensive to own a private jet (a Gulfstream jet costs about $30 million), several companies now offer fractional ownership programs that provide much of the convenience of having a private jet, but for a fraction of the cost. NetJets, FlexJet, and Raytheon Travel are among the leading companies offering fractional ownership programs.
To book a flight, a fractional owner calls the fleet operator and specifies the departure time, departure location and destination. The fleet operator then dispatches a plane and crew to pick up the customer. The fractional owners are charged for the flight time they use, but they are not charged for the time it takes to "reposition" the aircraft to pick up the customer or the time it takes to return the plane and crew to their base after completing the customer flights.
The flexibility provided to fractional jet owners poses operational challenges to the fleet operator. To succeed, the fleet operator must reliably satisfy customer requests and, to be profitable, they must keep the cost of repositioning aircraft low.
The Problem. We will consider a simplified version of the scheduling problem for a fictional European fleet operator called DayJets. In this simplified problem, planes and crews are based in four cities (Amsterdam, Barcelona, Copenhagen and Zurich) and customer demands can arise anywhere in Europe. We will assume that each day the DayJets planes and crews fly from their home base to the customer location in the morning. DayJets flies the customers wherever they need to go for the day and then returns the customers to their original location in the evening. (Thus customer flights are all round trips.) DayJets' planes then return to their home base at the end of the day.
DayJets' goal is to assign planes to customers to minimize the total cost of repositioning. You may assume that it costs €4.00 per kilometer to fly these repositioning legs or twice this (€8.00 per kilometer) for the round trip from the base to the customer and back again. We will initially assume that DayJets must meet customer demand using their own airplanes.
On a particular day, DayJets has 10 planes available and 8 customer requests to satisfy. The planes are located as indicated in Table 1. The travel distances (in kilometers) between these cities are shown in Table 2. (These data are available from the course web site.)
Use the worksheet ‘DayJets Table 2' in your exam workbook as a starting point.
Table 1: Locations of aircraft and customers
Aircraft/Crew Locations Customer Locations
Planes Planes
available Needed
|
Amsterdam
|
2
|
Copenhagen
|
1
|
|
Barcelona
|
2
|
Dublin
|
2
|
|
Copenhagen
|
2
|
Helsinki
|
1
|
|
Zurich
|
4
|
Lisbon
|
1
|
|
|
|
Liverpool
|
1
|
|
|
|
Venice
|
1
|
|
|
|
Vienna
|
1
|
Table 2: One--way travel distances (in kilometers) between cities
|
Amsterdam |
Barcelona |
Copenhagen |
Dublin |
Helsinki |
Lisbon |
Liverpool |
London |
Venice |
Vienna |
Zurich |
| Amsterdam |
0 |
987 |
499 |
546 |
1156 |
1409 |
423 |
216 |
810 |
731 |
547 |
| Barcelona |
987 |
0 |
1297 |
1312 |
1908 |
785 |
1189 |
981 |
860 |
1142 |
677 |
| Copenhagen |
499 |
1297 |
0 |
1045 |
609 |
1908 |
922 |
713 |
971 |
695 |
770 |
| Dublin |
546 |
1312 |
1045 |
0 |
1656 |
1734 |
170 |
332 |
1319 |
1268 |
974 |
| Helsinki |
1156 |
1908 |
609 |
1656 |
0 |
2520 |
1533 |
1324 |
1583 |
1110 |
1381 |
| Lisbon |
1409 |
785 |
1908 |
1734 |
2520 |
0 |
1611 |
1402 |
1645 |
1849 |
1384 |
| Liverpool |
423 |
1189 |
922 |
170 |
1533 |
1611 |
0 |
210 |
1196 |
1145 |
851 |
| London |
216 |
981 |
713 |
332 |
1324 |
1402 |
210 |
0 |
987 |
936 |
640 |
| Venice |
810 |
860 |
971 |
1319 |
1583 |
1645 |
1196 |
987 |
0 |
405 |
357 |
| Vienna |
731 |
1142 |
695 |
1268 |
1110 |
1849 |
1145 |
936 |
405 |
0 |
465 |
| Zurich |
547 |
677 |
770 |
974 |
1381 |
1384 |
851 |
640 |
357 |
465 |
0 |
QUESTIONS
1. Build a base model without Solver that contains the inputs provided, a decision grid about how many planes to assign from each city to each city, and a calculation section that computes total repositioning distance and total repositioning cost. Consider the following assignment plan:
Reposition 2 Amsterdam planes for 2 Dublin customers Reposition 1 Barcelona plane for 1 Helsinki customer Use 1 Copenhagen plane for 1 Copenhagen customer Reposition 1 Copenhagen plane for 1 Liverpool customer Reposition 1 Zurich plane for 1 Lisbon customer Reposition 1 Zurich plane for 1 Venice customer Reposition 1 Zurich plane for 1 Vienna customer
a. What is the total repositioning distance?
b. What is the total repositioning cost?
c. What planes are unused?
2. Make a copy of your base model and extend it to formulate and solve a linear optimization problem to determine the most efficient way to assign planes to customers: that is, find the plan that minimizes the total repositioning costs. Note: You do not need to include integer or binary constraints in your formulation of this problem. You can ignore any minor discrepancies (e.g., less than one millionth) from integer values.
a. What is the assignment plan (listed by quantity and location as in Question 1)?
b. What is the total repositioning distance for this plan?
c. What is the total repositioning cost for this plan?
3. Is the optimal solution you obtained in Question 2 unique? Please provide evidence for your answer from the Sensitivity Report created from your Question 2 solution model.
4. Make a copy of your Question 2 optimization model. In this copy, change the distance between Amsterdam and Liverpool from 423 km to 425 km. Make the same change to the distance between Liverpool and Amsterdam. Use the adjusted distance for all remaining questions. Solve the optimization model with the adjusted distance. What is the total repositioning cost for this plan?
5. Sensitivity analysis based on the Question 4 optimization model:
a. In the Sensitivity Report created from your Question 4 solution model, list the objective coefficient value for the number of planes assigned from Amsterdam to Barcelona and from Dublin to Venice. Please explain how each value relates to the problem statement inputs.
b. Is the optimal solution you obtained in Question 4 unique? Please provide evidence for your answer.
c. How would the total repositioning costs change if we added another customer in Vienna? Please explain in a sentence or two how your solution value relates to the problem statement inputs; that is, please interpret this change in repositioning costs in terms of the underlying problem (don't just say "Solver says" or "the sensitivity report says").
d. How would the total repositioning costs change if there were an additional plane available in Amsterdam? Please explain in a sentence or two how this number relates to the problem statement inputs; that is, please interpret this change in repositioning costs in terms of the underlying problem (don't just say "Solver says" or "the sensitivity report says").
6. Now suppose that in addition to using its own aircraft, DayJets can rent planes from other firms (charter firms or other fleet operators) to meet customer requests. This can reduce repositioning costs, but DayJets must pay the plane owner for use of the plane (and crew). The rented planes can then be repositioned to meet customer requests.
Planes are available for rental from the following four cities at the indicated fees:
Amsterdam: €3000
Copenhagen: €3000
London: €4000
Venice: €2500
These rental fees do not include the costs of repositioning the aircraft. You may assume the cost of repositioning the rented aircraft are the same as for DayJets' planes. You should also assume that there is exactly one plane available for rent at each of these locations.
Formulate and solve a new optimization problem that takes into account the possibility of renting planes.
a. Does your solution rent any planes? Is so, which ones?
b. What is the assignment plan (listed by quantity and location as in Question 1)?
c. How does this assignment plan differ from your solution to Question 4?
d. What is the total cost of this plan?