Reference no: EM132392721
Healthcare Operations and Supply Chain Management
1. The file Problem_1.xlsx contains on the processing time in blood test machine. Ideally, the processing time should be 12 minutes in each test. Every hour, 4 tests were randomly selected from the blood test machine and measured for actual processing time. This was repeated for 25 consecutive hours.
(1) Based on given data, determine appropriate control chart.
(2) Does this blood test appear to be in control?
(3) Estimate Cp and Cpk.
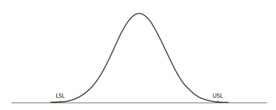
(4) Bonus problem: The blood test should place between LSL=11.95 minutes and USL = 12.05 minutes in each test. Based on the given sample data, calculate the probabilities that this blood test will yield processing time falling below the LSL.
Hint: Suppose the collected data follows Normal distribution. Then, you can imagine below graph. The next step is to find mean value and standard deviation from the collected data.
2. The following are the all activities in the network.
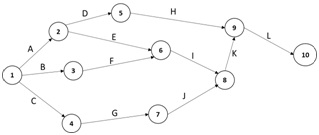
(1) Fill the below table.
|
Activity
|
Optimistic(ta)
|
Most Likely(tm)
|
Pessimistic(tb)
|
Expected Time(te)
|
Variance(σ2)
|
|
A
|
4
|
5
|
6
|
|
|
|
B
|
5
|
6
|
8
|
|
|
|
C
|
3
|
4
|
7
|
|
|
|
D
|
4
|
5
|
6
|
|
|
|
E
|
3
|
3
|
3
|
|
|
|
F
|
3
|
4
|
8
|
|
|
|
G
|
5
|
8
|
12
|
|
|
|
H
|
1
|
1
|
1
|
|
|
|
I
|
1
|
2
|
3
|
|
|
|
J
|
2
|
3
|
6
|
|
|
|
K
|
4
|
7
|
9
|
|
|
|
L
|
2
|
5
|
7
|
|
|
(2) Fill the below table. Then, find the critical path and expected time(CT) to complete this project.
|
Activity
|
ES
|
Expected Time
|
EF
|
LS
|
LF
|
S
|
|
A
|
|
|
|
|
|
|
|
B
|
|
|
|
|
|
|
|
C
|
|
|
|
|
|
|
|
D
|
|
|
|
|
|
|
|
E
|
|
|
|
|
|
|
|
F
|
|
|
|
|
|
|
|
G
|
|
|
|
|
|
|
|
H
|
|
|
|
|
|
|
|
I
|
|
|
|
|
|
|
|
J
|
|
|
|
|
|
|
|
K
|
|
|
|
|
|
|
|
L
|
|
|
|
|
|
|
(3) What is the probability that the project will not be completed in expected time(CT) + 5 days?
3. Lucas County Hospital has four physical test machines of type 1(M1), five of type 2(M2), three of type 3(M3) and seven of type 4(M4). Each machine operates 40 hours per week. Lucas County Hospital provide 5 physical test services. The problem is to determine the optimum weekly physical test service quantities using machines. The goal is to maximize total profit from physical test services. The following are machine data and processing requirements(hrs/unit).
|
Machine
|
Quantity
|
Service 1
|
Service 2
|
Service 3
|
Service 4
|
Service 5
|
|
M1
|
4
|
1.2
|
1.3
|
0.7
|
0.0
|
0.5
|
|
M2
|
5
|
0.7
|
2.2
|
1.6
|
0.5
|
1.0
|
|
M3
|
3
|
0.9
|
0.7
|
1.3
|
1.0
|
0.8
|
|
M4
|
7
|
1.4
|
2.8
|
0.5
|
1.2
|
0.6
|
|
Unit profit($)
|
|
$18
|
$25
|
$10
|
$12
|
$15
|
Formulate integer linear programming.
4. The billing department at Wood County Hospital is redesigning the layout of its office to manage bottlenecks better. You are responsible for assigning each employee involved in this process to a set of tasks. One major goal is to achieve equal work groupings, that is balance the line. The work elements to be performed are listed, along with their times and immediate predecessors.
|
Task
|
Time (sec)
|
Immediate Predecessors
|
|
A
|
60
|
-
|
|
B
|
40
|
A
|
|
C
|
30
|
B
|
|
D
|
20
|
B
|
|
E
|
40
|
B
|
|
F
|
60
|
C
|
|
G
|
70
|
D
|
|
H
|
50
|
F, G
|
|
I
|
20
|
E
|
|
J
|
60
|
H, I
|
(1) Construct a precedence diagram.
(2) What is the desired cycle time? What is the theoretical minimum number of steps?
(3) Balance the line using the longest activity time as a heuristic and depict the process. Then, compute the efficiency of the process.
5. At Mercy Hospital, two workers process insurance claims every day. Insurance claims arrive to be processed on an average of one every 10 minutes throughout the day. It takes an average of 12 minutes to process. Both time between arrivals and service times are exponentially distributed.
(1) What is the expected number of claims waiting to be processed?
(2) What is the probability that both workers are busy?
(3) What is the effect on performance if a third worker, working at the same speed as the first two, is added to the system? Repeat (1) and (2).
6. Arrivals to an Emergency Department(ED) are all directed to the same entrance. At a certain time of the day, these arrivals form a Poisson process with rate 30 per hour. The time to check-in a patient is a constant 90 seconds. Determine LQ, wQ , L , w and for this ED. If a delayed check-in costs $5,000 per hour on the average, determine the average cost per patient of delay in waiting to check-in.
7. Arrivals to a reception desk at ProMedica have an interarrival time that follows the distribution shown in the next table. Service times follow another empirical distribution, also shown in the table. There is only one customer service representative who starts work at time 0.
|
Interarrival Time
|
pdf
|
|
2
|
0.2
|
|
3
|
0.25
|
|
4
|
0.4
|
|
5
|
0.15
|
|
Service Time
|
pdf
|
|
1
|
0.1
|
|
2
|
0.15
|
|
3
|
0.3
|
|
4
|
0.25
|
|
5
|
0.2
|
Using Problem 7.xlsx, conduct the simulation for the next 300 arrivals. Find average waiting time, average time in the system and total time in the system. If time in the system is valued at $30.00 per hour and the service representative is paid $15.00 per hour, what is the total cost of this system? You need to use Random Number Generation function in the Excel we covered in Appendix 5.3.
8. BPH's MRI lab has 8 jobs to complete today. Your objective is minimizing tardiness and the number of tardy jobs. Requests start being processed at time 0. Using FCFS, SPT, EDD, CR, and Moor's algorithm, determine jobs sequence. Also, evaluate job sequencing algorithms.
|
Job Sequence
|
Arrival Time (min)
|
Processing Time (min)
|
Due Date
|
|
1
|
10
|
70
|
100
|
|
2
|
30
|
90
|
150
|
|
3
|
60
|
90
|
160
|
|
4
|
100
|
50
|
220
|
|
5
|
120
|
150
|
300
|
|
6
|
160
|
100
|
320
|
|
7
|
200
|
120
|
330
|
|
8
|
210
|
150
|
400
|
Attachment:- Data File.rar