Reference no: EM132595382
Practice exercise 1
1. What is an hypothesis?
2. What is the difference between a population and a sample?
3. Why do researchers use samples?
4. Why is it important for the sample to accurately represent the population?
5. What is the difference between a null hypothesis and a research hypothesis?
6. What are two types of research hypotheses?
7. What is the difference between a directional and non-directional hypothesis?
8. What type of hypothesis corresponds to a one-tail test?
Practice Exercise 2
(1) What are the 3 characteristics of the normal normal distribution?
(2) What percent of scores fall in between -1SD and +1SD on a normal curve?
(3) What are standard scores?
(4) What are the units of measurements of a standard score?
(5) How would you explain a Z score of 1.25 with respect to its position relative to the mean
Practice exercise 3
Using the following data and the Descriptive function in SPSS to answer each of the
Following questions:
21 25 21 19 16 18 19 19 16 24 21 21 17 26 20 23 20 21 20
SPSS Outputs
Table 1: mean and variance from SPSS
|
Descriptive Statistics
|
|
|
N
|
Mean
|
Std. Deviation
|
|
VAR00001
|
19
|
20.37
|
2.753
|
|
Valid N (listwise)
|
19
|
|
|
|
|
|
|
|
Table 2: Z scores and Normal probabilities
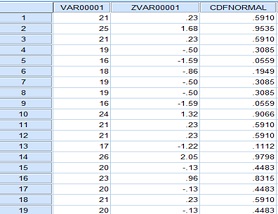
1. What is the mean?
2. What is the standard deviation?
3. What is the z score for each of the following:
From the SPSS Screenshot above
a. Z Score for 16 =
b. Z Score for 21 =
c. Z Score for 25 =
4. Assuming the above data was normally distributed, what percent of scores are equal to
or less than each of the following scores (Use Table B.1):
a. 20
b. 26
c. 17
5. For a one-tailed test or directional hypothesis, the researcher is interested in results that occur in only one tail of the normal curve (e.g., they are interested in extreme high scores or extreme low scores). Therefore, when using the 5% criteria to judge the likelihood of a score, the researcher identifies the score that divides the curve into two parts (one part containing 95% of the scores and the other part containing 5% of the scores). What value of z separates the normal curve into these two sections? (You may need to refer to Table B.1).
6. For each of the following scores, use the one-tail five percent (5%) criteria and Determine if the occurrence of the score would be considered relatively likely or Unlikely?
a. 18
b. 24
c. 25
7. For a two-tailed test or nondirectional hypothesis, the researcher is interested in results That occur in either tail of the normal curve (e.g., they are interested in extreme high Scores and extreme low scores). Therefore, when using the 5% criteria to judge the Likelihood of a score, the researcher identifies the score that divides the curve into three Parts (the first part containing the lower 2.5% of scores, the second part containing the middle 95% of the scores, and the third part containing the upper 2.5% of the scores).
What value of z separates the normal curve into these three sections? (You may need to refer to Table B.1).
8. For each of the following scores, use the two-tail five percent (5%) criteria and Determine if the occurrence of the score would be considered relatively likely or Unlikely?
a. 25
b. 26
9. Why a score of 25 was considered unlikely in #6 but not unlikely in #8?