Reference no: EM131404727
The average January temperatures (y) and geographic latitudes (x) of 20 cities in the United States were given in the table for Exercise 2. The regression equation for these data was given in Exercise 1 as = 1.26 - 2.34x. The value of r2 for this relationship is 73.3%. What is the correlation between average January temperature and latitude for these 20 cities?
Exercise 1
The average January temperatures (y) and geographic latitudes (x) of 20 cities in the United States were given in the table for Exercise 2. (The data are part of the temperature dataset on the companion website.) The regression equation for these data is
y^ = 1.26 - 2.34x
a. What is the slope of the line? Interpret the slope in terms of how mean January temperature is related to change in latitude.
b. Pittsburgh, Pennsylvania, has a latitude of 40, and Boston, Massachusetts, has a latitude of 42. Use the slope to predict the difference in expected average January temperatures for these two cities. Compare your answer to the actual difference in average January temperature for these two cities using the data shown in the table for Exercise 2.
c. Predict the average January temperature for a city with latitude 33.
d. Refer to part (c). Identify the two cities in the table that have a latitude of 33 and compute the residual (prediction error) for each of these cities. Discuss the meaning of these two residuals in the context of this example, identifying whether each city is warmer or cooler than predicted.
Exercise 2
The data in the following table are the geographic latitudes and the average August and January temperatures (Fahrenheit) for 20 cities in the United States. The cities are listed in geographic order from south to north. (These data are part of the temperature dataset on the companion website.)
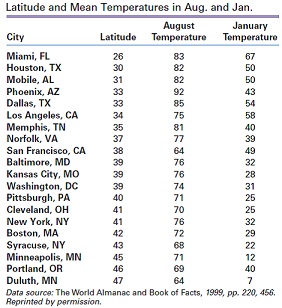
a. Draw a scatterplot of y = August temperature versus x = latitude.
b. Is the pattern linear or curvilinear? What is the direction of the association?
c. Are there any cities that appear to be outliers because they don't fit the pattern of the rest of the data? If so, which city or cities are they?
|
Discuss the abnormal child and adolescent psychology
: You are a counselor in a child and adolescent center. Your boss asks you to see a mother with her 3-year-old son. The mother brings her son to your office, and they are hostile toward each other. She states that he is hyperactive and has ADHD. She..
|
|
Describe in detail the budgets that you work with
: Describe in detail the budgets that you work with. Based on the effectiveness of the budget, what recommendations would you suggest to improve the communication and/or utilization of the budget(s)?
|
|
Do you agree with the given prediction
: This prediction is based on extrapolation, which assumes that the current rate of increase will continue indefinitely. Is that a reasonable assumption? Do you agree with the prediction? Explain.
|
|
How does this compare against the result for an array list
: An element can be inserted at or removed from the beginning, middle, or end of a linked list. Which of the three locations is the most computationally expensive, and why? How does this compare against the result for an array list?
|
|
What is the slope of the line
: What is the slope of the line? Interpret the slope in terms of how mean January temperature is related to change in latitude.
|
|
Compute depreciation expense on the machine for year ending
: ACC 5370- Compute depreciation expense on the machine for the year ending December 31, 2014, and the year ending December 31, 2015, using the following methods.
|
|
How did new deal legislation try to stabilize agriculture
: What issue dominated the first 100 days of obama administration back in 2009? Why are the first 100 days so important for a president? How did new deal legislation try to stabilize agriculture and industry
|
|
How use of balanced scorecard can increase economic value
: Explain each of your recommendations. Using these measures as examples, explain how use of the balanced scorecard can increase the economic value added within the organization.
|
|
Explain what you know and do not know about the strength
: Suppose you know that the slope of a regression line is b1 = +3.5. Based on this value, explain what you know and do not know about the strength and direction of the relationship between the two variables.
|