What is the slope of the least-squares line

Assignment Help Basic Statistics
Reference no: EM131669332

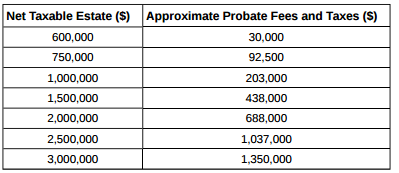
Question: According to a flyer by a Prudential Insurance Company representative, the costs of approximate probate fees and taxes for selected net taxable estates are as follows:

1210_86.png

a. Decide which variable should be the independent variable and which should be the dependent variable.

b. Draw a scatter plot of the data.

c. Does it appear from inspection that there is a relationship between the variables? Why or why not?

d. Calculate the least-squares line. Put the equation in the form of: y = a + bx.

e. Find the correlation coefficient. Is it significant?

f. Find the estimated total cost for a next taxable estate of $1,000,000. Find the cost for $2,500,000.

g. Does it appear that a line is the best way to fit the data? Why or why not?

h. Are there any outliers in the data?

i. Based on these results, what would be the probate fees and taxes for an estate that does not have any assets?

j. What is the slope of the least-squares (best-fit) line? Interpret the slope.

Reference no: EM131669332

Questions Cloud

Should either company accept the project : Should either company accept the project, and if so, under what conditions?
Find the estimated heights for stories : The height (sidewalk to roof) of notable tall buildings in America is compared to the number of stories of the building (beginning at street level).
How the organization sources candidates for global roles : Identify at least three soft skills the organization requires of employees in global roles. Explain how the organization sources candidates for global roles.
Statute of limitation on assessment expire : Suppose the omission was deliberate and not inadvertent. When does the statute of limitation on assessment expire?
What is the slope of the least-squares line : According to a flyer by a Prudential Insurance Company representative, the costs of approximate probate fees and taxes for selected net taxable estates.
How you apply epidemiology skills to justify policy changes : How would you apply your epidemiology skills to justify and establish policy changes that can prevent and reduce childhood and adult obesity in your county?
Compute the weighted average cost of capital : Mr. Washburn, the vice-president of finance, has given you the following information and has asked you to compute the weighted average cost of capital.
Examine your own cultural influences in the delivery : Examine your own cultural influences in the delivery of culturally competent nursing care to diverse cultural groups.
Describe the disease in terms of three levels of prevention : Lyme disease cases occur very frequently in many areas of New England. How would you describe the disease in terms of three levels of prevention?

Reviews

Write a Review

Basic Statistics Questions & Answers

  Statistics-probability assignment

MATH1550H: Assignment:  Question:  A word is selected at random from the following poem of Persian poet and mathematician Omar Khayyam (1048-1131), translated by English poet Edward Fitzgerald (1808-1883). Find the expected value of the length of th..

  What is the least number

MATH1550H: Assignment:  Question:     what is the least number of applicants that should be interviewed so as to have at least 50% chance of finding one such secretary?

  Determine the value of k

MATH1550H: Assignment:  Question:     Experience shows that X, the number of customers entering a post office during any period of time t, is a random variable the probability mass function of which is of the form

  What is the probability

MATH1550H: Assignment:Questions: (Genetics) What is the probability that at most two of the offspring are aa?

  Binomial distributions

MATH1550H: Assignment:  Questions:  Let’s assume the department of Mathematics of Trent University has 11 faculty members. For i = 0; 1; 2; 3; find pi, the probability that i of them were born on Canada Day using the binomial distributions.

  Caselet on mcdonald’s vs. burger king - waiting time

Caselet on McDonald’s vs. Burger King - Waiting time

  Generate descriptive statistics

Generate descriptive statistics. Create a stem-and-leaf plot of the data and box plot of the data.

  Sampling variability and standard error

Problems on Sampling Variability and Standard Error and Confidence Intervals

  Estimate the population mean

Estimate the population mean

  Conduct a marketing experiment

Conduct a marketing experiment in which students are to taste one of two different brands of soft drink

  Find out the probability

Find out the probability

  Linear programming models

LINEAR PROGRAMMING MODELS

Free Assignment Quote

Assured A++ Grade

Get guaranteed satisfaction & time on delivery in every assignment order you paid with us! We ensure premium quality solution document along with free turntin report!

All rights reserved! Copyrights ©2019-2020 ExpertsMind IT Educational Pvt Ltd