Reference no: EM132361450
Data Interpretation Assignment - Questions & Answers
Q1. The bar graph given below shows the data of the production of paper (in lac tones) by Three different companies x, y and z over the years. Production of paper (in lac tones) by Three companies x, y and z over the years.
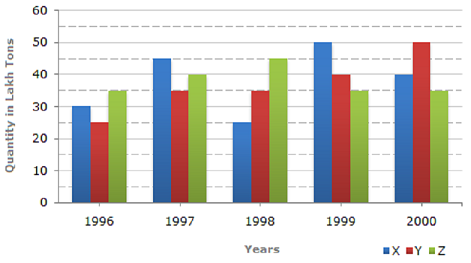
1. For which of the following years, the percentage rise/fall in production from the previous year Is the maximum for company y?
A.1997
B.1998
C.1999
D.2000
2. What is the ratio of the average production of company x in the period 1998-2000 to the Average production of company y in the same period?
A. 1:1
B. 15:17
C. 23:25
D. 27:29
3. The average production for five years was maximum for which company?
A. X
B. Y
C. Z
D. X and Z both
4. In which year was the percentage of production of company z to the production of company Y the maximum?
A.1996
B.1997
C.1998
D.1999
5. What is the percentage increase in the production of company y from 1996 to 1999?
A. 30%
B. 45%
C. 50%
D. 60%
Q2. A cosmetic company provides five different products. The sales of these five products (in Lakh number of packs) during 1995 and 2000 are shown in the following bar graph. Sales (in lakh number of packs) of five different products of cosmetic company during 1995 And 2000.
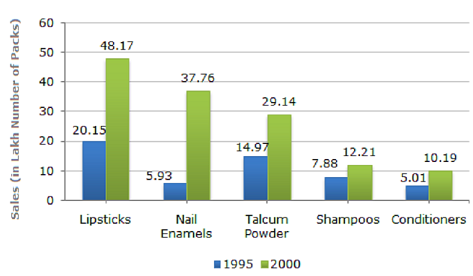
1. The sales of lipsticks in 2000 was by what percent more than the sales of nail enamels in 2000? (Rounded off to nearest integer)
A. 33%
B. 31%
C. 28%
D. 22%
2. During the period 1995-2000, the minimum rate of increase in sales is in the case of?
A. Shampoos
B. Nail enamels
C. Talcum powders
D. Lipsticks
3. What is the approximate ratio of the sales of nail enamels in 2000 to the sales of talcum Powders in 1995?
A. 7:2
B. 5:2
C. 4:3
D. 2:1
4. The sales have increased by nearly 55% from 1995 to 2000 in the case of?
A. Lipsticks
B. Nail enamels
C. Talcum powders
D. Shampoos
5. The sales of conditioners in 1995 was by what percent less than the sales of shampoos in 1995? (Rounded off to nearest integer)
A. 57%
B. 36%
C. 29%
D. 25%