Reference no: EM132222452
Statistics Assignment -
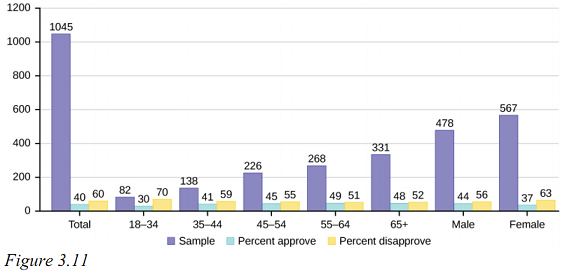
Q1. The graph in Figure 3.11 displays the sample sizes and percentages of people in different age and gender groups who were polled concerning their approval of Mayor Ford's actions in office. The total number in the sample of all the age groups is 1,045.
a. Define three events in the graph.
b. Describe in words what the entry 40 means.
c. Describe in words the complement of the entry in question 2.
d. Describe in words what the entry 30 means.
e. Out of the males and females, what percent are males?
f. Out of the females, what percent disapprove of Mayor Ford?
g. Out of all the age groups, what percent approve of Mayor Ford?
h. Find P(Approve|Male).
i. Out of the age groups, what percent are more than 44 years old?
j. Find P(Approve|Age < 35).
Use the graph in figure 3.12 for questions 2 - 12.
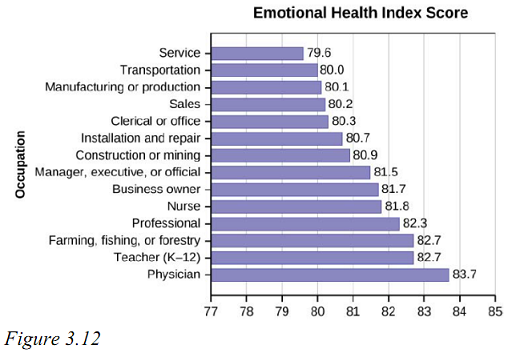
Q2. The graph shown is based on more than 170,000 interviews done by Gallup that took place from January through December 2012. The sample consists of employed Americans 18 years of age or older. The Emotional Health Index Scores are the sample space. We randomly sample one Emotional Health Index Score.
Find the probability that an Emotional Health Index Score is 81.0.
Q3. The graph shown is based on more than 170,000 interviews done by Gallup that took place from January through December 2012. The sample consists of employed Americans 18 years of age or older. The Emotional Health Index Scores are the sample space. We randomly sample one Emotional Health Index Score.
Find the probability that an Emotional Health Index Score is more than 81?
Q4. The graph shown is based on more than 170,000 interviews done by Gallup that took place from January through December 2012. The sample consists of employed Americans 18 years of age or older. The Emotional Health Index Scores are the sample space. We randomly sample one Emotional Health Index Score.
Find the probability that an Emotional Health Index Score is between 80.5 and 82?
Q5. The graph shown is based on more than 170,000 interviews done by Gallup that took place from January through December 2012. The sample consists of employed Americans 18 years of age or older. The Emotional Health Index Scores are the sample space. We randomly sample one Emotional Health Index Score.
If we know an Emotional Health Index Score is 81.5 or more, what is the probability that it is 82.7?
Q6. The graph shown is based on more than 170,000 interviews done by Gallup that took place from January through December 2012. The sample consists of employed Americans 18 years of age or older. The Emotional Health Index Scores are the sample space. We randomly sample one Emotional Health Index Score.
What is the probability that an Emotional Health Index Score is 80.7 or 82.7?
Q7. The graph shown is based on more than 170,000 interviews done by Gallup that took place from January through December 2012. The sample consists of employed Americans 18 years of age or older. The Emotional Health Index Scores are the sample space. We randomly sample one Emotional Health Index Score.
What is the probability that an Emotional Health Index Score is less than 80.2 given that it is already less than 81?
Q8. The graph shown is based on more than 170,000 interviews done by Gallup that took place from January through December 2012. The sample consists of employed Americans 18 years of age or older. The Emotional Health Index Scores are the sample space. We randomly sample one Emotional Health Index Score.
What occupation has the highest emotional index score?
Q9. The graph shown is based on more than 170,000 interviews done by Gallup that took place from January through December 2012. The sample consists of employed Americans 18 years of age or older. The Emotional Health Index Scores are the sample space. We randomly sample one Emotional Health Index Score.
What occupation has the lowest emotional index score?
Q10. The graph shown is based on more than 170,000 interviews done by Gallup that took place from January through December 2012. The sample consists of employed Americans 18 years of age or older. The Emotional Health Index Scores are the sample space. We randomly sample one Emotional Health Index Score.
What is the range of the data?
Q11. The graph shown is based on more than 170,000 interviews done by Gallup that took place from January through December 2012. The sample consists of employed Americans 18 years of age or older. The Emotional Health Index Scores are the sample space. We randomly sample one Emotional Health Index Score.
Compute the average EHIS.
Q12. The graph shown is based on more than 170,000 interviews done by Gallup that took place from January through December 2012. The sample consists of employed Americans 18 years of age or older. The Emotional Health Index Scores are the sample space. We randomly sample one Emotional Health Index Score.
If all occupations are equally likely for a certain individual, what is the probability that he or she will have an occupation with lower than average EHIS?
Q13. On February 28, 2013, a Field Poll Survey reported that 61% of California registered voters approved of allowing two people of the same gender to marry and have regular marriage laws apply to them. Among 18 to 39 year olds (California registered voters), the approval rating was 78%. Six in ten California registered voters said that the upcoming Supreme Court's ruling about the constitutionality of California's Proposition 8 was either very or somewhat important to them. Out of those CA registered voters who support same-sex marriage, 75% say the ruling is important to them. In this problem, let:
- C = California registered voters who support same-sex marriage.
- B = California registered voters who say the Supreme Court's ruling about the constitutionality of California's Proposition 8 is very or somewhat important to them.
- A = California registered voters who are 18 to 39 years old.
a. Find P(C).
b. Find P(B).
c. Find P(C|A).
d. Find P(B|C).
e. In words, what is C|A?
f. In words, what is B|C?
g. Find P(C AND B).
h. In words, what is C AND B?
i. Find P(C OR B).
j. Are C and B mutually exclusive events? Show why or why not.
Q14. The casino game, roulette, allows the gambler to bet on the probability of a ball, which spins in the roulette wheel, landing on a particular color, number, or range of numbers. The table used to place bets contains of 38 numbers, and each number is assigned to a color and a range.
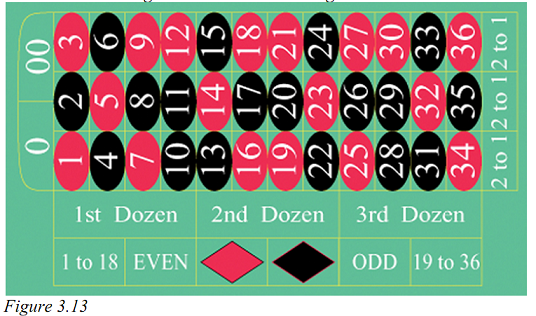
Compute the probability of winning the following types of bets:
a. Betting on two lines that touch each other on the table as in 1-2-3-4-5-6.
b. Betting on three numbers in a line, as in 1-2-3.
c. Betting on one number.
d. Betting on four numbers that touch each other to form a square, as in 10-11-13-14.
e. Betting on two numbers that touch each other on the table, as in 10-11 or 10-13.
f. Betting on 0-00-1-2-3.
g. Betting on 0-1-2; or 0-00-2; or 00-2-3.
Q15. Suppose that you have eight cards. Five are green and three are yellow. The five green cards are numbered 1, 2, 3, 4, and 5. The three yellow cards are numbered 1, 2, and 3. The cards are well shuffled. You randomly draw one card.
- G = card drawn is green
- E = card drawn is even-numbered
a. List the sample space.
b. P(G) =_____
c. P(G|E) =_____
d. P(G AND E) =_____
e. P(G OR E) =_____
f. Are G and E mutually exclusive? Justify your answer numerically.
Q16. A special deck of cards has ten cards. Four are green, three are blue, and three are red. When a card is picked, its color of it is recorded. An experiment consists of first picking a card and then tossing a coin.
a. List the sample space.
b. Let A be the event that a blue card is picked first, followed by landing a head on the coin toss. Find P(A).
c. Let B be the event that a red or green is picked, followed by landing a head on the coin toss. Are the events A and B mutually exclusive? Explain your answer in one to three complete sentences, including numerical justification.
d. Let C be the event that a red or blue is picked, followed by landing a head on the coin toss. Are the events A and C mutually exclusive? Explain your answer in one to three complete sentences, including numerical justification.
Q17. An experiment consists of tossing a nickel, a dime, and a quarter. Of interest is the side the coin lands on.
a. List the sample space.
b. Let A be the event that there are at least two tails. Find P(A).
c. Let B be the event that the first and second tosses land on heads. Are the events A and B mutually exclusive? Explain your answer in one to three complete sentences, including justification.
Q18. Three professors at George Washington University did an experiment to determine if economists are more selfish than other people. They dropped 64 stamped, addressed envelopes with $10 cash in different classrooms on the George Washington campus. 44% were returned overall. From the economics classes 56% of the envelopes were returned. From the business, psychology, and history classes 31% were returned.
Let: R = money returned; E = economics classes; O = other classes
a. Write a probability statement for the overall percent of money returned.
b. Write a probability statement for the percent of money returned out of the economics classes.
c. Write a probability statement for the percent of money returned out of the other classes.
d. Is money being returned independent of the class? Justify your answer numerically and explain it.
e. Based upon this study, do you think that economists are more selfish than other people? Explain why or why not. Include numbers to justify your answer.
Q19. United Blood Services is a blood bank that serves more than 500 hospitals in 18 states. According to their website, a person with type O blood and a negative Rh factor (Rh-) can donate blood to any person with any blood-type.
Their data show that 43% of people have type O blood and 15% of people have Rh- factor; 52% of people have type O or Rh- factor.
a. Find the probability that a person has both type O blood and the Rh- factor.
b. Find the probability that a person does NOT have both type O blood and the Rh- factor.
Q20. In a box of assorted cookies, 36% contain chocolate and 12% contain nuts. Of those, 8% contain both chocolate and nuts. Sean is allergic to both chocolate and nuts.
a. Find the probability that a cookie contains chocolate or nuts (he can't eat it).
b. Find the probability that a cookie does not contain chocolate or nuts (he can eat it).
Q21. A college finds that 10% of students have taken a distance learning class and that 40% of students are part time students. Of the part time students, 20% have taken a distance learning class. Let D = event that a student takes a distance learning class and E = event that a student is a part time student.
a. Find P(D AND E).
b. Find P(E|D).
c. Find P(D OR E).
d. Using an appropriate test, show whether D and E are independent.
e. Using an appropriate test, show whether D and E are mutually exclusive.
Q22. The table shows the political party affiliation of each of 67 members of the US Senate in June 2012, and when they are up for reelection.
|
P for reelection:
|
Democratic Party
|
Republican Party
|
Other
|
Total
|
|
November 2014
|
20
|
13
|
0
|
|
|
November 2016
|
10
|
24
|
0
|
|
|
Total
|
|
|
|
|
What is the probability that a randomly selected senator is a Democrat and up for reelection in November 2016?
Q23. The table shows the political party affiliation of each of 67 members of the US Senate in June 2012, and when they are up for reelection.
|
P for reelection:
|
Democratic Party
|
Republican Party
|
Other
|
Total
|
|
November 2014
|
20
|
13
|
0
|
|
|
November 2016
|
10
|
24
|
0
|
|
|
Total
|
|
|
|
|
Suppose that a member of the US Senate is randomly selected. Given that the randomly selected senator is up for reelection in November 2016, what is the probability that this senator is a Democrat?
Q24. Given Table gives the number of suicides estimated in the U.S. for a recent year by age, race (black or white), and sex. We are interested in possible relationships between age, race, and sex. We will let suicide victims be our population.
|
Race and Sex
|
1-14
|
15-24
|
25-64
|
over 64
|
TOTALS
|
|
white, male
|
210
|
3,360
|
13,610
|
|
22,050
|
|
white, female
|
80
|
580
|
3,380
|
|
4,930
|
|
black, male
|
10
|
460
|
1,060
|
|
1,670
|
|
black, female
|
0
|
40
|
270
|
|
330
|
|
all others
|
|
|
|
|
|
|
TOTALS
|
310
|
4,650
|
18,780
|
|
29,760
|
a. Fill in the column for the suicides for individuals over age 64.
b. Fill in the row for all other races.
c. Find the probability that a randomly selected individual was a white male.
d. Find the probability that a randomly selected individual was a black female.
e. Find the probability that a randomly selected individual was a black.
f. Find the probability that a randomly selected individual was a black or white male.
g. Out of the individuals over age 64, find the probability that a randomly selected individual was a black or white male.
Q25. In a previous year, the weights of the members of the San Francisco 49ers and the Dallas Cowboys were published in the San Jose Mercury News. The factual data were compiled into the following table.
|
Shirt#
|
≤ 210
|
211-250
|
251-290
|
>290
|
|
1-33
|
21
|
5
|
0
|
0
|
|
34-66
|
6
|
18
|
7
|
4
|
|
66-99
|
6
|
12
|
22
|
5
|
For the following, suppose that you randomly select one player from the 49ers or Cowboys.
a. Find the probability that his shirt number is from 1 to 33.
b. Find the probability that he weighs at most 210 pounds.
c. Find the probability that his shirt number is from 1 to 33 AND he weighs at most 210 pounds.
d. Find the probability that his shirt number is from 1 to 33 OR he weighs at most 210 pounds.
e. Find the probability that his shirt number is from 1 to 33 GIVEN that he weighs at most 210 pounds.
Q26. This tree diagram shows the tossing of an unfair coin followed by drawing one bead from a cup containing three red (R), four yellow (Y) and five blue (B) beads. For the coin, P(H) = 2/3 and P(T) = 1/3 where H is heads and T is tails.
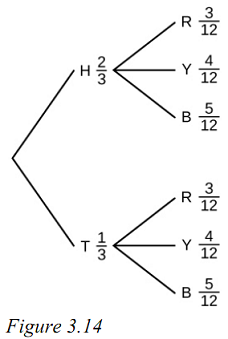
Find P (tossing a Head on the coin AND a Red bead).
a. 2/3
b. 5/15
c. 6/36
d. 5/36
Q27. This tree diagram (figure 3.14) shows the tossing of an unfair coin followed by drawing one bead from a cup containing three red (R), four yellow (Y) and five blue (B) beads. For the coin, P(H) = 2/3 and P(T) = 1/3 where H is heads and T is tails.
Find P (Blue bead).
a. 15/36
b. 10/36
c. 10/12
d. 6/36
Q28. A box of cookies contains three chocolate and seven butter cookies. Miguel randomly selects a cookie and eats it. Then he randomly selects another cookie and eats it. (How many cookies did he take?)
a. Draw the tree that represents the possibilities for the cookie selections. Write the probabilities along each branch of the tree.
b. Are the probabilities for the flavor of the SECOND cookie that Miguel selects independent of his first selection? Explain.
c. For each complete path through the tree, write the event it represents and find the probabilities.
d. Let S be the event that both cookies selected were the same flavor. Find P(S).
e. Let T be the event that the cookies selected were different flavors. Find P(T) by two different methods: by using the complement rule and by using the branches of the tree. Your answers should be the same with both methods.
f. Let U be the event that the second cookie selected is a butter cookie. Find P(U).