Reference no: EM13861238
1) Classify each of the following as nominal, ordinal, interval, or ratio data.
a. The time required to produce each tire on an assembly line
b. The number of quarts of milk a family drinks in a month
c. The ranking of four machines in your plant after they have been designated as excellent, good, satisfactory, and poor
d. The telephone area code of clients in the United States
e. The age of each of your employees
f. The dollar sales at the local pizza house each month
g. An employee's identification number
h. The response time of an emergency unit
2) True or False: The highest level of data measurement is the ratio-level measurement.
3) True or False: Interval- and ratio-level data are also referred to as categorical data.
4) A small portion or a subset of the population on which data is collected for conducting statistical analysis is called __________.
5) One of the advantages for taking a sample instead of conducting a census is this:
a sample is more accurate than census
a sample is difficult to take
a sample cannot be trusted
a sample can save money when data collection process is destructive
6) Selection of the winning numbers is a lottery is an example of __________.
convenience sampling
random sampling
nonrandom sampling
regulatory sampling
7) A type of random sampling in which the population is divided into non-overlapping subpopulations is called __________.
stratified random sampling
cluster sampling
systematic random sampling
regulatory sampling
8) A type of random sampling in which every kth item (where k is some number) in the population is selected for inclusion in the sample is called __________.
stratified random sampling
cluster sampling
systematic sampling
regulatory sampling
9) Judgment sampling is an example of __________.
convenience sampling
random sampling
nonrandom (non-probabilistic) sampling
justice department sampling
10) For the following data, construct a frequency distribution with six classes.
57 23 35 18 21
26 51 47 29 21
46 43 29 23 39
50 41 19 36 28
31 42 52 29 18
28 46 33 28 20
11) What type of graph would be most appropriate for the frequency distribution above?
Pie chart
Bar chart
Pareto diagram
Histogram
12) For the following frequency distribution, determine the relative frequency, percent, and the cumulative frequency.
*Round your answer to 3 decimal places, the tolerance is +/-0.001.
Class Interval Frequency
20-under 25 17
25-under 30 20
30-under 35 16
35-under 40 15
40-under 45 8
45-under 50 6
TOTAL 82
13) True or False: Frequency distribution is a summary of data presented in the form of class intervals and frequencies.
14) True or False: The range of a data set is defined as the difference between the mean and the median.
15) True or False: The sum of the relative frequencies of a grouped data set is always equal to one.
16) The U.S. Department of the Interior releases figures on mineral production. Following are the values (in billions of dollars) of the 15 leading states in nonfuel mineral production in the United States in 2008.
1.68, 1.81, 1.85, 1.89, 2.05, 2.05, 2.08, 2.74, 3.21, 3.30, 4.00, 4.17, 4.20, 6.48, 7.84
a. Calculate the mean, median, and mode.
b. Calculate the range, interquartile range, sample variance, and sample standard deviation.
c. Compute the coefficient of skewness for these data and interpret.
17) The following graphic of residential housing data (selling price and size in square feet) indicates:
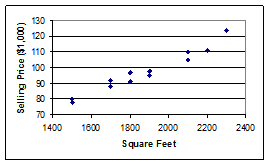
a correlation close to -1
a correlation close to 0 (no relation between the two variables)
a correlation close to 1
a negative relationship between the two variables
18) The Polk Company reported that the average age of a car on U.S. roads in a recent year was 7.5 years.
a) Suppose the distribution of ages of cars on U.S. roads is approximately bell-shaped. If 99.7% of the ages are between 1 year and 14 years, what is the standard deviation of car age?
b) Suppose the standard deviation is 1.7 years and the mean is 7.5 years. Between what two values would 95% of the car ages fall?
19) A large manufacturing firm tests job applicants who recently graduated from college. The test scores are bell shaped with a mean of 500 and a standard deviation of 50.
a) What proportion of people get scores between 400 and 600?
b) What proportion of people get scores higher than 450?
c) Management is considering placing a new hire in an upper level management position if the person scores in the upper 0.15% of the distribution. What is the lowest score a college graduate can earn to qualify for the position?
20) According to the Bureau of Labor Statistics, the average annual salary of a worker in Detroit, Michigan, is $35,748. Suppose the median annual salary for a worker in this group is $31,369 and the mode is $29,500.
a) Is the distribution of salaries for this group skewed? If so, how and why?
b) Which of these measures of central tendency would you use to describe these data? Why?
21) True or False: The median is the most frequently occurring value in a set of data.
22) True or False: A disadvantage of the mean as the measure of central tendency is that it is affected by extremely large or extremely small values in the data set.
23) True or False: The variance is the average of the squared deviations about the arithmetic mean for a set of numbers.
24) What is the median for the following five numbers? 223, 264, 216, 218, 229
25) The second quartile of a data set is always equal to its ________.
26) The sum of deviations from the mean for a data set is equal to __________.
27) Scores obtained by students in an advanced placement test has a symmetric mound shaped (bell shaped) distribution with a mean of 70 and a standard deviation of 10. What is the proportion of students who received between 60 and 80 points.
28) For the previous problem, what is the proportion of students who received less than 50 points?
29) The following joint probability table contains a breakdown on the age and gender of U.S. physicians in a recent year, as reported by the American Medical Association.
|
|
Age of U.S. Physicians
|
|
|
|
< 35
|
35 - 44
|
45 - 54
|
55 - 64
|
> 65
|
TOTAL
|
|
Male
|
0.11
|
0.20
|
0.19
|
0.12
|
0.16
|
0.78
|
|
Female
|
0.07
|
0.08
|
0.04
|
0.02
|
0.01
|
0.22
|
|
TOTAL
|
0.18
|
0.28
|
0.23
|
0.14
|
0.17
|
1.00
|
a) What is the probability that one randomly selected physician is 35-44 years old?
b) What is the probability that one randomly selected physician is both a woman and 45-54 years old?
c) What is the probability that one randomly selected physician is a man or is 35-44 years old?
d) What is the probability that one randomly selected physician is less than 35 years old or 55-64 years old?
e) What is the probability that one randomly selected physician is a woman if she is 45-54 years old?
f) What is the probability that a randomly selected physician is neither a woman nor 55-64 years old?
30) Purchasing Survey asked purchasing professionals what sales traits impressed them most in a sales representative. Seventy-eight percent selected "thoroughness." Forty percent responded "knowledge of your own product." The purchasing professionals were allowed to list more than one trait. Suppose 27% of the purchasing professionals listed both "thoroughness" and "knowledge of your own product" as sales traits that impressed them most. A purchasing professional is randomly sampled.
a) Make a probability table including the above information.
b) What is the probability that the professional selected "thoroughness" or "knowledge of your own product"?
c) What is the probability that the professional selected neither "thoroughness" nor "knowledge of your own product"?
d) If it is known that the professional selected "thoroughness," what is the probability that the professional selected "knowledge of your own product"?
e) What is the probability that the professional did not select "thoroughness" and did select "knowledge of your own product"?
31) From a previous midterm: The table below contains data from a sample of 200 people regarding opinion about the latest congressional plan to eliminate anti-trust exemptions for professional baseball (broken down by gender).
|
|
OPINION ABOUT THE PLAN
|
|
|
|
For
|
Neutral
|
Against
|
Totals
|
|
Female
|
38
|
54
|
12
|
104
|
|
Male
|
12
|
36
|
48
|
96
|
|
Totals
|
50
|
90
|
60
|
200
|
Please show your work for parts "a" through "e" or no credit will be given!
a) What is the probability that a person selected at random is for the plan?
b) If we know that the person is a female, what is the probability that the person is for the plan?
c) What is the probability that the person is male and is against the plan?
d) What is the probability that the person is male or is neutral about the plan?
e) Is opinion about the plan related to gender, or are opinion and gender independent? Please use statistical concepts and numerical calculations in your answer.
32) True or False: If two events are independent, the joint probability of the two events is always equal to the product of the marginal probabilities of two events.
33) True or False: If the conditional probability of an event A given another event B is same as the marginal probability of the event A, then events A and B are mutually exclusive.
34) If the occurrence or non-occurrence of one event does not affect the occurrence or non-occurrence of another event, the two events are ________________________.
35) A listing of all elementary outcomes (i.e. the outcomes which cannot be broken down into other events) of an experiment (i.e. a decision making situation under uncertainty) is called a __________.
36) How many different combinations of a 3-member debating team can be formed from a group of 16 qualified students?