Reference no: EM13810924
1) High jumpers usually sustain fractures in the lower third of the fibula. The world record for the high jump is held by Javier Sotomayor (Cuba) at 2.45 m (1993). If he weighed 68 kg could muster a run-up speed of 9 ms-1, had a center of mass which was 1.2 m of the floor and took 0.3 s to push off from the floor then calculate the stress in his fibula. Note that during the Fosbury Flop the higher jumper pushes of from the ground using both feet, the cross-sectional area of the fibula is 1 cm2, and that the fibula plays a minor role in weight-bearing with the tibia supporting approximately 95% of the weight. Stress is defined as force per unit area.
i. In order for Javier to make the jump how much energy does he need? Note he only has to raise his center of mass to 2.45 m from 1.2 m.
ii. By balancing potential energy and kinetic energy, how much velocity does he need?
iii. Given that it took an estimated 0.3 s for this velocity to be acquired, what was his acceleration and what is the force required to generate this acceleration.
iv. If the fibula only provides 5% of this force then how much force is that? And given the definition of stress, what is the stress in the fibula?
2) A shotgun fires a large number of pellets upward, with some pellets traveling very nearly vertically and others as much as 1.0o from the vertical. Assume that the initial speed of the pellets is uniformly 150 m s-1 and ignore air resistance. Within what radius from the point of firing will the pellets land? If there are 1000 pellets, and they fall in a uniform distribution over a circle with the radius you just calculated, what is the probability that at least one pellet will fall on the head of the person who fires the gun?
For this question you might need to brush up on your high school math. Hows your probability?
i. Use the range equation to find the furthest that a bullet could land.
ii. If 1000 bullets fall in a circle with this radius then we can find the probability of at least one bullet falling on the shooters head. First make up the area of his head, say, 0.01 m2?
What is the probability of a single bullet hitting the guy?
iii. What is the probability of one bullet missing the guys head?
iv. What is the probability that all the bullets will miss?
v. What is the probability that not all of the bullets will miss, and that at least one will hit?
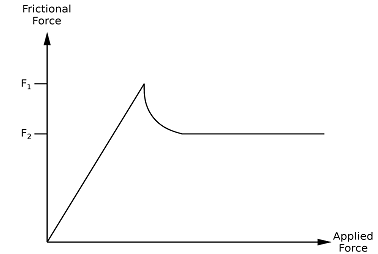
3) Consider the experiment shown below. A block is pulled across a flat but rough surface. The force applied to the block is plotted on the x-axis while the frictional force due to the surface of the block and the rough surface is plotted on the y-axis.

What is the value of the applied force when the frictional force is equal to F1? Explain the features of the graph. Sketch a plot of the position of the block as a function of time, assuming the applied force ramps up linearly with time. Sketch a plot of the velocity of the block as a function of time, assuming the applied force ramps up linearly with time. Sketch a plot of the acceleration of the block as a function of time, assuming the applied force ramps up linearly with time. There are some key words here. "Flat surface" implies that you can ignore gravity, but "rough surface" implies that friction is going to be important.
i. The first thing the problem asks is to give the value of the applied force when the frictional force is equal to F1. As the static friction opposes the applied force, then the frictional force and applied force should be equal. The block isn't moving yet!
ii. You should be able to explain this graph. If not then consult your notes.
iii. You have to provide plots of position, velocity and acceleration. I would consider these in the reverse order. First what is the net force acting on the block as a function of time? Recall that the applied force is said to increase linearly with time. The acceleration is just proportional to the net force (applied force minus frictional force). Second, if you have acceleration as a function of time, then the integration of this would give you velocity. In other words, the velocity vs time plot is the area under the curve of the acceleration vs time graph. Thirdly, the position vs time is the area under the curve of the velocity vs time graph.