Reference no: EM1318090
Question 1. In the x11 multiplicative decomposition method (Y = T x C x S x ε) an MA 3 smoother is applied to the estimated cycle-error (Cε component) series to reveal the cycle component. Why the choice of MA 3 here compared to other smoothers or window sizes?
Question 2. A simple exponential forecast model is being applied to forecast sales figures (in 1000s of computers) for Dell computers. The last period’s sales figure was 125, while it was forecasted to be 134.3. The weighting parameter is α = 0.25.
(i) What is the point forecast of sales in the next time period?
(ii) What is the 95% forecast interval for the next period’s sales figure? (use z = 1.96)
Show all working.
The simple exponential forecasting formula is:

Question 3. List two issues that can help choose between quantitative and qualitative forecasting methods. Give one brief reason why each can help in this choice.
Question 4. Which forecasting method forms a forecast by weighting the most recent data (in time) more highly than less recent data?
Question 5. Regarding quantitative forecasting, what are the main differences between an intuitive method and a formal statistical model?
Question 6. Describe/List the main differences between qualitative and quantitative forecasting methods.
Question 7. Which measure of forecast accuracy should be used in the following situations?
(i) A small number of large forecast errors needs to be guarded against.
(ii) Errors need to be measured in percentage terms.
(iii) Whether a model’s forecasts are biased is more important than the typical size of errors.
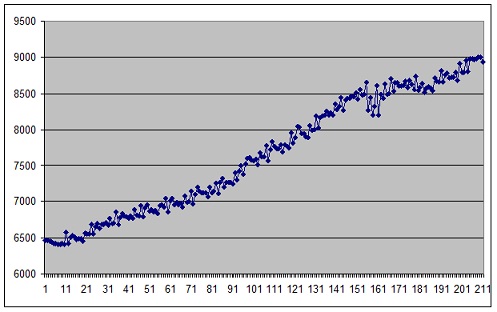
Question 8. Consider the following time series plot showing annual labour force data in Australia.
 (i) Describe the main features or components apparent in the data
(ii) List three quantitative forecast models that might be tried for this data, with brief motivation for each choice.
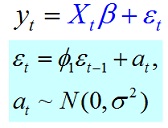
Question 9. The time series model with autoregressive order 1 errors can be written as:

(i) Derive the formula for the 2 step-ahead point forecast E(yt+2| y1,t).
(ii) Now derive the formula for the 100(1-α)% forecast interval for yt+2| y1,t.
(iii) What component does the formula for ε attempt to capture? Explain exactly how it tries to achieve this when forecasting (a picture might help here).
Question 10. Find the weights, showing all working, for the following centred smoothers:
(i) 2 x 6 MA
(ii) 3 x 3 MA
(iii) 3 x 7 MA
(iv) Indicate how many missing observations there will be at the start and end of each smoothed series in (i)-(iii).
(v) Identify each smoother in (i)-(iii) as a WMA-k. What is k?
(vi) Is each smoother in (i)-(iii) symmetric? Justify your answer
(vii) Devise a symmetric smoother that is an WMA 5 so that the weight on time t is 1.5 times the weight at times t-1 and t+1; and double the weight at times t-2, t+2
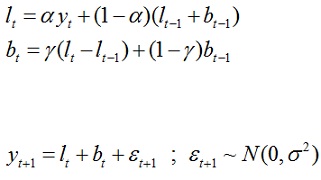
Question 11. The Holt-Winters additive model is given by the equations:

Showing all working, complete the following:
(i) Put this model in error correction form.
(ii) Derive the 1, 2 and 3 step-ahead forecasts from this model. Explain briefly why this model is called the ‘local-linear’ forecasting model.
(iii) Discuss exactly how the model in (ii) is different to simply applying a linear trend (with normal errors) as follows:
(iv) The h-step ahead forecast and forecast variances from the model in (ii) are:

What happens to the forecasts and forecast intervals as h gets larger? What happens as h tends to infinity? Explain how and why this behaviour can be reasonable in a statistical model.
|
Consider the continuous random variable x
: Consider the continuous random variable X, which has a uniform distribution over the interval from 20 to 28. The probability that X will take on a value between 21 and 25 is.
|
|
An experiment consists of making 80 telephone calls
: In textile industry, a manufacturer is interested in the number of blemishes or flaws occurring in each 100 feet of material. Of the following probability distributions, the one that most applies to this situation is the.
|
|
Integrated services architecture
: Explain how has the integrated services architecture is being provided a solution to growing variety and volume of traffic experienced within the Internet and Intranets? Describe in scholarly detail.
|
|
The probability density function f(x) represents
: The function that defines the probability distribution of a continuous random variable is a?For a continuous random variable x, the probability density function f(x) represents.
|
|
What is the point forecast of sales
: What is the point forecast of sales in the next time period? What is the 95% forecast interval for the next period’s sales figure? (use z = 1.96)
|
|
Creating the c program
: Write down a program which accepts a name for example, chocolate bluberries price per pound, and number of the pounds sold in average month .
|
|
Negotiation situation
: Describe a situation where you were in a negotiation situation and did or did not communicate effectively as part of the process.
|
|
Characteristic of normal probability distribution
: A uniform probability distribution is a continuous probability distribution where the probability that the random variable assumes a value in any interval of equal length is.
|
|
Control health insurance premiums
: From the first e-Activity, determine to what extent companies should be able to use employee data and dictate participation in wellness programs to control health insurance premiums.
|