Reference no: EM13686141
Q1. Use tables and properties to find the CTFTs (f-form) of the following signals. Plot the magnitudes and phases of the found CTFTs:
a) g(t) = 5 δ(4t).
b) g(t) = u(2t) + u(t-1)
c) g(t) = sgn(t) - sgn(-t)
d) g(t) = rect[(t+1)/2] + rect[ (t-1)/2].
Q2. A periodic signal has a fundamental period of 4s.
a) What is the lowest positive frequency at which the CTFT could be non-zero?
b) What is the next-lowest positive frequency at which the CTFT could be non-zero?
Q3. Find and plot the time domain signal that corresponds to the frequency representation displayed in the figure below (For the plot, use A = 1, = 95 kHz, and =105 kHz.).

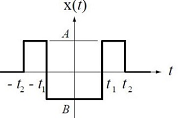
Q4. Find the CTFT (the f-form) of the signal displayed below, and sketch its magnitude and phase (for the plot, use A = -B =1, t1 = 1, and t2 = 2).
Hint: Express the signal as the sum of two functions and use the linearity property.
