Reference no: EM131404592
The average January temperatures (y) and geographic latitudes (x) of 20 cities in the United States were given in the table for given Exercise. (The data are part of the temperature dataset on the companion website.) The regression equation for these data is
y^ = 1.26 - 2.34x
a. What is the slope of the line? Interpret the slope in terms of how mean January temperature is related to change in latitude.
b. Pittsburgh, Pennsylvania, has a latitude of 40, and Boston, Massachusetts, has a latitude of 42. Use the slope to predict the difference in expected average January temperatures for these two cities. Compare your answer to the actual difference in average January temperature for these two cities using the data shown in the table for given Exercise.
c. Predict the average January temperature for a city with latitude 33.
d. Refer to part (c). Identify the two cities in the table that have a latitude of 33 and compute the residual (prediction error) for each of these cities. Discuss the meaning of these two residuals in the context of this example, identifying whether each city is warmer or cooler than predicted.
Exercise
The data in the following table are the geographic latitudes and the average August and January temperatures (Fahrenheit) for 20 cities in the United States. The cities are listed in geographic order from south to north. (These data are part of the temperature dataset on the companion website.)
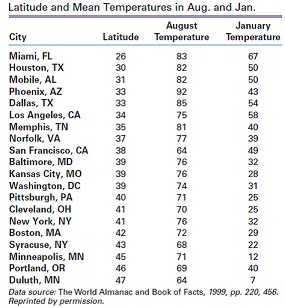
a. Draw a scatterplot of y = August temperature versus x = latitude.
b. Is the pattern linear or curvilinear? What is the direction of the association?
c. Are there any cities that appear to be outliers because they don't fit the pattern of the rest of the data? If so, which city or cities are they?
|
Determine whether or not us could adopt their taxation model
: Determine whether or not the U.S. could adopt their taxation model without reducing its total amount of revenue generated by collecting personal income taxes from individuals and business.
|
|
Describe the type of business you have created
: Describe the type of business you have created including the product or service, and general staffing plan. Provide a rationale for your plan. The form of your business and the benefits it offers your particular business.
|
|
Draw a scatterplot of the data
: The following table shows the relationship between the speed of a car (mph) and the average stopping distance (feet) after the brakes are applied:- Draw a scatterplot of the data.
|
|
Discuss about the competitive environment
: Competitive environment : Entry / exit barriers, buyer / supplier power, substitutes, rivalry.Competitive landscape : Significant players, levels of competition, major issues.Profile key competitors : Relative position, advantage, market share, profi..
|
|
What is the direction of the association
: Draw a scatterplot of y = August temperature versus x = latitude.- Is the pattern linear or curvilinear? What is the direction of the association?
|
|
Describe purpose and content of each of the given reports
: Explain the purpose and content of each of these reports. Express your thoughts on other types of financial statement reports such as Qualified Opinions, Adverse Opinions, and Disclaimer of Opinions.
|
|
Discuss about the ethical and environmental responsibility
: Ownership of "commons'-some argue that natural resources such as water or air should be publicly-held (i.e., by governments and citizens), others argue that privatizing them (i.e., shifting ownership to private companies) will actually contribute ..
|
|
Write a memo to the budget managers in an organization
: Write a memo to the budget managers in an organization, assuming you are the CEO. Your memo should direct budget managers not to utilize this approach, but also offer a logical rationale, and perhaps an alternative solution.
|
|
Write python code to generate three lists of random numbers
: DS 710 Homework 6 - R assignment. Write Python code to generate three lists of random numbers which model potential revenue: one list with 12 months of revenue using the current mean and standard deviation, another list with 12 months of revenue u..
|