What is the difference in proportions in the original data

Assignment Help Applied Statistics
Reference no: EM13218947

First save this file to your computer. Answer each of the following questions, then resave the file along with your answers and turn it in using the assignment link in Module 3, Activity 4.the first four problems are worth 10 points each. Problems 5 and 6 are worth 30 points each.

1. If the original sample is 48, 55, 43, 61, 39, which of the following would not be a possible bootstrap sample? Explain why it wouldn't be.

a) 48, 55, 43, 61, 39

b) 43, 39, 56, 43, 61

c) 55, 48, 55, 48, 61

d) 39, 39, 39, 39, 39

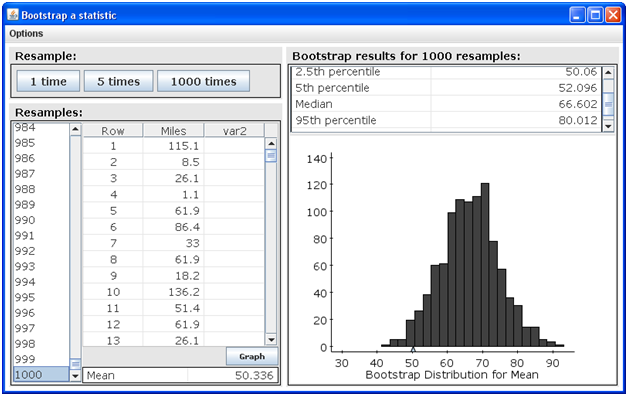
2. The following bootstrap output is for mileage of a random sample of 25 mustang cars.
699_What is the difference in proportions in the original data.png

Based on a 90% confidence interval, which of the following would not be a plausible value of the population mean, µ? Explain why it wouldn't be.

a) 60.01

b) 80.01

c) 55

d) 52

3. Which of the following p-values would provide more evidence in support of the alternate hypothesis and against the null hypothesis? Explain your answer.

a) 0.15

b) 0.85

c) 0.009

d) 0.05

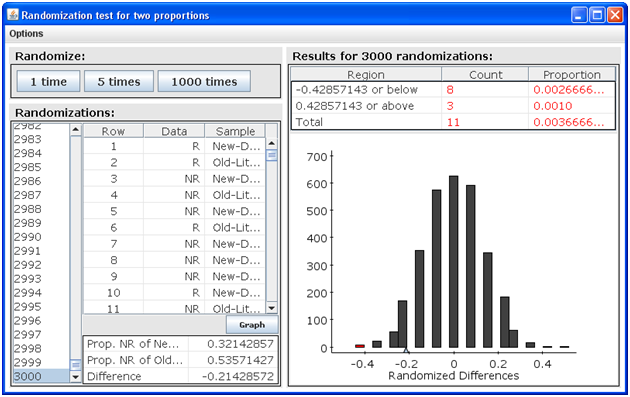
4. In a sample of 56 addicts, 28 were given a new drug to help them overcome their addiction, while the remaining 28 were given the current drug. The following is the output from a randomization test for the difference in the proportion of addicts suffering relapses.

a) What is the difference in proportions in the original data?

b) What is the p-value and what does it mean in terms of this specific problem?
1564_What is the difference in proportions in the original data1.png

In StatCrunch Assignment 1A, you selected a random sample of 30 StatCrunch U students and gathered some survey data regarding those students. Use the StatCrunch data file you created to complete the remainder of this assignment.

5. Construct a bootstrap distribution of the credit card debt data from your sample using 3000 resamples.

a) Paste a copy of your distribution here. (With a PC, you can press the control-alt-fn-F11 keys to copy the window showing the distribution.)

b) What is the mean of your original sample?

c) What is the 95% confidence interval estimate of the population mean obtained from your bootstrap distribution?

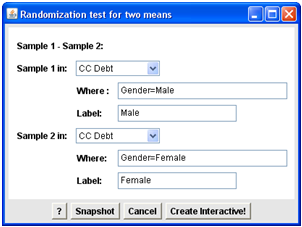
6. Suppose you want to compare the amount of credit card debt for males and females. The null hypothesis for this problem would be no difference in the mean amount of credit card debt for males and females and the alternate hypotheses would be that there is a difference in mean amounts of credit card debt.  Conduct a randomization test for two means with 3000 randomizations. (Your input menu should be as follows.)
420_What is the difference in proportions in the original data2.png

a) Paste the output from your randomization test here.

b) What is the mean difference in credit card debt of the two groups in the original data?

c) What p-value did you get in your randomization? Explain in the context of the problem what the p-value means.

d) Do you think the data support the null hypothesis of no difference in mean credit card debt between males and females or the alternate hypothesis that there is a difference? Explain your answer.

Reference no: EM13218947

Questions Cloud

Calculate the s/n ratio for a receiver output : Calculate the S/N ratio for a receiver output of 4 V signal and 0.48 V noise both as a ratio and in decibel form. (69.44, 18.42dB)
Find the power being absorbed : A current source of 12 cos 2000t A, a 200-ohm resistor, and a 0.2-H inductor are in parallel. Assume steady-state conditions exist. At t = 1 ms, find the power being absorbed by the (a) resistor; (b) inductor; (c) sinusoidal source.
Discuss the importance of sleep and your circadian rhythms : Discuss the importance of sleep and your circadian rhythms. Discuss the effects of culture on our views of personality
Would the cards count as part of the money supply : Many colleges sell special cards that students can use to purchase everything from textbooks or meals in the cafeteria to use of washing machines in the dorm. Students deposit money in their cards; as they use their cards for purchases.
What is the difference in proportions in the original data : What is the difference in proportions in the original data and what is the p-value and what does it mean in terms of this specific problem
Difference between respect for authority and blind obedience : What is the difference between respect for authority and blind obedience? How do you tell the difference?
Explain the cash method of accounting : Although the company maintains a certain level of plumbing supplies for its business inventory it is not a material income producing factor; thus, material purchases are expenses. The partnership uses the cash method of accounting for revenue and ..
What is the cross price elasticity of demand : What is the cross price elasticity of demand between XYZ's and AB C's widgets?
Aisan americans and pacific islanders aer a model minority : If someone told you (a) Aisan Americans and Pacific Islanders aer a model minority , and (b) Asians Americans and Pacific Islanders belong to a single Asian American culture, what do you say to them to convince them both statements are misconceptions

Reviews

Write a Review

Applied Statistics Questions & Answers

  Hypothesis testing

What assumptions about the number of pedestrians passing the location in an hour are necessary for your hypothesis test to be valid?

  Calculate the maximum reduction in the standard deviation

Calculate the maximum reduction in the standard deviation

  Calculate the expected value, variance, and standard deviati

Calculate the expected value, variance, and standard deviation of the total income

  Determine the impact of social media use on student learning

Research paper examines determine the impact of social media use on student learning.

  Unemployment survey

Find a statistics study on Unemployment and explain the five-step process of the study.

  Statistical studies

Locate the original poll, summarize the poling procedure (background on how information was gathered), the sample surveyed.

  Evaluate the expected value of the total number of sales

Evaluate the expected value of the total number of sales

  Statistic project

Identify sample, population, sampling frame (if applicable), and response rate (if applicable). Describe sampling technique (if applicable) or experimental design

  Simple data analysis and comparison

Write a report on simple data analysis and comparison.

  Analyze the processed data in statistical survey

Analyze the processed data in Statistical survey.

  What is the probability

Find the probability of given case.

  Frequency distribution

Accepting Manipulation or Manipulating

Free Assignment Quote

Assured A++ Grade

Get guaranteed satisfaction & time on delivery in every assignment order you paid with us! We ensure premium quality solution document along with free turntin report!

All rights reserved! Copyrights ©2019-2020 ExpertsMind IT Educational Pvt Ltd