What is the dependent variable and the factor of interest

Assignment Help Basic Statistics
Reference no: EM131868267

Project -

Write your answers in the space provided in your own words.

1. Presbycusis is the graduated hearing loss that occurs as a person ages. An estimated one-quarter of Americans between the ages of 65 and 75 and three-quarters of those older than 75 have some degree of hearing loss.

An audiologist is interested in the efficacy of three different types of hearing aids. He gathers three groups of hearing-impaired clients: one group receives analog hearing aids, which convert sound waves into amplified electrical signals. The second group receives digital hearing aids, which use directional microphones to control the flow of sound and convert the sound waves into numerical codes before amplifying them. The third group receives cochlear implants. The results come in, and a statistician conducts an analysis of variance.

a. Determine which is the null and alternate hypothesis by marking an X in the table in the correct box.

Research Question

Alternative Hypothesis

Null Hypothesis

At least one of the population means is different from another.


There is no difference between the population means.


b. In this study what is the hearing aid type considered?

c. What are the treatments (analog hearing aids, digital hearing aids, and cochlear implants) considered?

2. List some of the assumptions underlying the independent-measures ANOVA.

3. What is the difference between repeated-measures and independent-measures designs?

4. Suppose you are interested in studying whether temperature affects spatial reasoning abilities. You decide to test spatial reasoning using completion time scores for the paper-folding test with five people, repeating the test on each person with three different temperatures (40 degrees, 60 degrees, and 80 degrees Fahrenheit).

a. In this experiment, what is the null hypothesis?

b. What is the factor of interest?

c. What is the dependent variable?

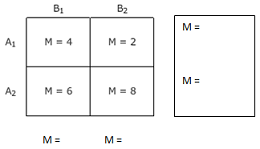
5. The results of a two-factor, independent-measures, equal n experiment are summarized in the following matrix. The numerical value in each cell is the mean score obtained from the sample in that treatment condition. Compute the overall means for the scores A1 the scores in A2, the scores in B1, and the scores in B2. Enter each of the means to the right of the appropriate row or below the appropriate column in the matrix.

1350_figure.png

Reference no: EM131868267

Questions Cloud

Yield to maturity and yield to call : What is the yield to call if they are called in 5 years? Which yield might investors expect to earn on these bonds? why?
What is the optimal order quantity at each warehouse : What is the optimal order quantity at each warehouse? What is the corresponding total cost (ordering + holding cost) in the system?
Identify the pros and cons of a jit relationship : Dixon Audio Systems had developed a reputation as a leading producer of speakers, audio systems, and car stereos. Dixon accomplished this through creating.
Forecasted cash flows for each project is as follows : Gardial Fisheries is considering two mutually exclusive investments. The forecasted cash flows for each project is as follows:
What is the dependent variable and the factor of interest : Suppose you are interested in studying whether temperature affects spatial reasoning abilities. What is the dependent variable and the factor of interest
Distinguish between functional and dysfunctional conflict : Distinguish between functional and dysfunctional conflict and discuss why people avoid conflict. Give me an example where either in personal or professional.
What would the slope of the yield curve be : If the risk premiums were all zero, as in the expectetions hypothesis, what would the slope of the yield curve be?
Company cost of preferred stock for in calculating wacc : What is the company’s cost of preferred stock for use in calculating the WACC?
Which scenario gives the lowest unit cost : Now consider cost. Assume that workers are paid $10.00/hr , machines cost $50.00/hr and can produce 60 units/hr if running.

Reviews

Write a Review

Basic Statistics Questions & Answers

  Determine the standard deviation and variation

Explain why the graph you provided gave a good visual representation of the data. Determine the standard deviation and variation, and explain their importance in statistical analysis of a data set.

  How data would collected in prospective observational study

A teacher wants to determine how class attendance during the term affects grades on the final exam.

  Developing a vision-mission-goals and objectives

1. Developing a vision, mission, goals and objectives, etc. are all important parts of making a strategic plan.

  Create a data set

Create a set of 5 positive numbers (repeats allowed) that have median 10 and mean 7. What thought process did you use to create your numbers?

  Comment on likely direction of causation

A firm finds the coefficient of correlation between y annual sales and y = annual expenditure on research and development to be r = +0.90. Comment on the likely direction of causation, if any, between these variables.

  Confidence interval for population parameter

The width of a confidence interval will be:

  Find the probability that on any given day the car

Find the probability that on any given day the car will get more than 26 miles per gallon when driven in the city.

  Find the probability to have conservative and a republican.

Find the probability that a randomly chosen respondent is conservative given that she or he is a Republican.

  Why to bother testing if true mean is fifty ppm

Obvious tests In many cases, hypothesis testing is used when the evidence is obvious. For example, why would you even bother testing if the true mean is 50 ppm?

  Expect to get from the following questions

What type of data would you expect to get from the following questions? Make suggestions as to how these questions could be improved?

  Data analysis on creativitypre and creativitypost

Please construct an appropriate chart/graph that displays the relevant information for these two variables (comparative mean score of creative pre-post test).

  Determining sample size to obtain the error

What sample size would be required to obtain the error of ±10 square millimeters with 99 percent confidence?

Free Assignment Quote

Assured A++ Grade

Get guaranteed satisfaction & time on delivery in every assignment order you paid with us! We ensure premium quality solution document along with free turntin report!

All rights reserved! Copyrights ©2019-2020 ExpertsMind IT Educational Pvt Ltd