Reference no: EM131242851
Environmental Risk Analysis Assignment
1. Define "verification" and "validation' and describe the difference between these terms_ Describe haw each might he accomplished when performing an environmental risk analysis.
2. Define "advection' and "dispersion". Are these processes conservative or non- conservative processes?
3. What is the equation that is the fundamental definition of the distribution coefficient? Define all terms used in the equation. What three important conditions are assumed in this equation?
4. Describe the role of sediments in the transport of contaminant (a) in a river and (b) in a lake.
5. In the diagram below, draw where you might expect to find (a) an LNAPL and (b) a DNAPL several years after a chemical spill on the land surface.

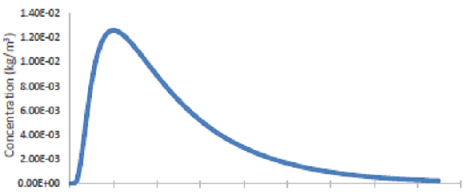
6. (a) The graph below shows the concentration of a contaminant downstream of an instantaneous release. Label the x-axis of this graph as "time" or "distance" and explain how you know which it is.
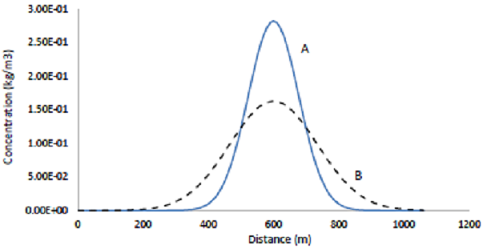
(b) The graph below shows two possibilities for the concentration of a contaminant downstream of where it was released instantaneously into a river. The two modeled possibilities are the same except for the assumed longitudinal dispersion. Which one is using the higher dispersion coefficient? How do you know?
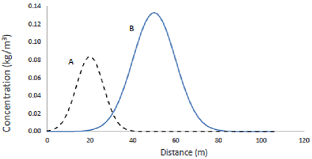
(c) The graph below shows the aqueous concentrations ultimo different contaminants down-gradient of where they were instantaneously released into an aquifer as a mixture of chemicals. Which contaminant has the higher KD value? Flow do you know?
7. Use this figure to find the following:
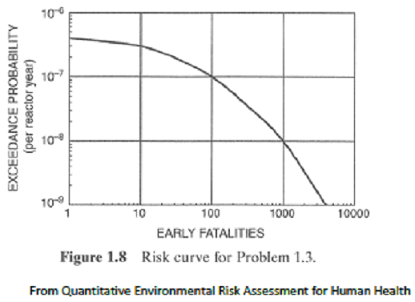
(a) What is the probability of more than 1000 fatalities in a year
(b) What is the probability of less than 10 fatalities in a year?
8. A facility discharges effluent containing chromium into a river. The effluent from the facility has a flow rate of 0.05 m3/s and has a concentration of 10 mg/L. The river has a flow rate of 10 m3/s upstream from the facility. Upstream from the facility, the river is contaminated with chromium from other pollution sources and has a concentration of chromium of 0.01 mg/L. What is the concentration of chromium in the river downstream from the facility?
9. A mis-labeled valve at a new fertilizer production plant resulted in operators venting a tank of anhydrous ammonia to the atmosphere instead of into the production process. Ammonia vented from the tank for 3 hours before the mistake was discovered. The actual release rate into the atmosphere was described by

A graph of the actual release is provided below
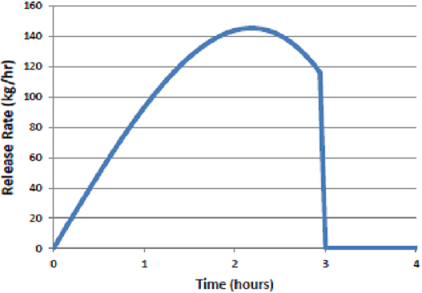
(a) How much ammonia was released to the atmosphere?
(b) Write an expression to calculate the time of the maximum re ease rate (set up the equation only completing the derivative is not necessary).
(c) Write an expression to approximate the release as a finite step function between 0 and 3 hours and sketch it on the graph.
(d) State the relationship between the area under the two curves on the graph (the curve provided and the curve drawn in part (c).
10. A facility discharges -effluent containing 50 mg/L of uranium into a lake at a flow rate of 0.01 m3/s. The lake has a volume of 2000 m3 and a depth of 2 m. A small stream with a flow rate of 0.05 m3/s flows through the lake. This stream does not contain any uranium contamination. The lake has a suspended sediment concentration of 100 mg/L. The settling velocity of these sediments is 5 x10⁻⁶ m/s. Uranium sorbs onto these sediments with a distribution coefficient of 450 L/kg. There is no chemical or biological degradation of uranium in the lake.
(a) What fraction of the uranium is sorbed onto the suspended sediment?
(b) What is the concentration of uranium in the aqueous phase In the lake at steady state? Report the answer in units of mg/L.
11. System leaks in valves and pipes in a nuclear power plant have released tritium, 3H into the soil at the site, where it percolates through the vadose zone and reaches the aquifer at a point approximately 500 m from the site boundary. Tritium migrates with the water (i.e., no sorption) and decays with a first order decay rate of 0.056/yr. The porosity of the aquifer is 0.30 and the effective porosity is 0.25. The hydraulic conductivity, kHr was determined in site pumping tests to be 5 x 10⁻³ cm/s and the hydraulic head gradient between the plant and the location of the peak 3H concentration is -0.01.
If the aqueous concentration is approximated as 1-dimensional transport resulting from a semi-infinite release and a high Peclet number is assumed, the aqueous concentration of 3H between the point where it enters the aquifer and the plant boundary can be approximated with the following equation:
Cl(x, t) ≈ (Cl0/2)erfc[-(Rx - ut/√(4αLuRt))]exp(-k(Rx/u))
(a) In the equation above, what value should be used for k?
(b) What value should be used for R?
(c) What value should be used for u?
(d) Estimate a value of αL that could be used to calculate the concentration of 3H at the plant boundary.
Textbook - QUANTITATIVE ENVIRONMENTAL RISK ANALYSIS FOR HUMAN HEALTH BY ROBERT A. FJELD, NORMAN A. EISENBERG AND KEITH L. COMPTON.
Assignment link - https://www.dropbox.com/s/pewqshz7oylv26w/Assignment.rar?dl=0.