Reference no: EM131228249
Identify
Q1) Examine the data set on the worksheet Q1. This should be familiar; you saw this data set in last week's homework. Recall that this is a survey of 500 households. The definitions of the variables can be found by reading the comments (the little red triangles).
a) Suppose we wanted to examine the distribution of the variable Utilities. It would be appropriate to create a histogram, but we would like to identify measures like the mean, median, and quartiles. What other type of graph could you create?
b) In order to examine the relationship between the variables First_Income and Second_Income, what type of graph should be created? What summary measures, if any, should be calculated?
c) In order to examine the relationship between the variables Location and Monthly_Payment, what type of graph should be created? What summary measures, if any, should be calculated?
Execute
Q2) Examine the data set in the worksheet Q2. This data set lists the 15 players on the 2015-2016roster of the Los Angeles Lakers. The variables include the name, position, and salary for each player.
Create a side-by-side boxplot for Salary, broken out by Position. In other words, there should be 5 boxplots, one showing the distribution of salaries for those who play center, one showing the distribution of salaries for those who play point guard, and so on. Specifically, this should all be in a single graph.
Q3) Examine again the data in sheet Q1 (there is no sheet Q3.) We would like to know if the size on one's family has an effect on their income. Keeping in mind which is the explanatory variable and which is the response variable, create a scatterplot of the variables First_Incomeand Family Size. Be sure to include the correlation coefficient.
Q4) Who has been most likely to access the internet over the past decade? Consider the survey data collected from 1,000 randomly selected internet users, given in Q4. Create pivot tables to answer each of the following questions, and be sure to highlight your answer:
a) i. What proportion (percentage) of these internet users is currently employed?
ii. What is the average salary of the employed internet users in this sample?
b) What proportion (percentage) of these internet users is single with no formal education beyond the high school?
c) What proportion (percentage) of these internet users are men under the age of 30?
Interpret
Q5) Interpret the following. What do you learn? What conclusions can you draw?
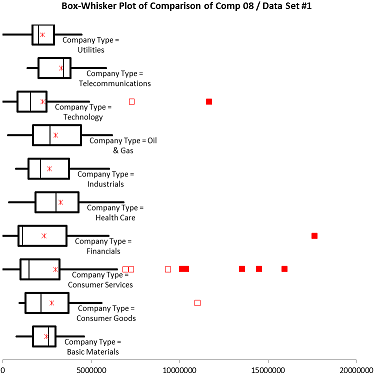
In May of 2008, a study was published examining CEO compensation (salary and bonus.) In last week's homework, you viewed a boxplot of the distribution of compensation, as well as summary measures. Here is the same data, now broken out by company type (there were 10 different company types surveyed: from Basic Materials to Utilities). Side-by-side boxplots are on the next page. Again, what can you conclude?
|
Comp 08 (Basic Materials)
|
Comp 08 (Consumer Goods)
|
Comp 08 (Consumer Services)
|
Comp 08 (Financials)
|
Comp 08 (Health Care)
|
|
One Variable Summary
|
Data Set #1
|
Data Set #1
|
Data Set #1
|
Data Set #1
|
Data Set #1
|
|
Mean
|
$2,483,329
|
$2,787,126
|
$2,987,036
|
$2,342,734
|
$3,292,771
|
|
Std. Dev.
|
$886,448
|
$1,815,164
|
$3,312,399
|
$2,784,996
|
$1,732,319
|
|
Median
|
$2,583,000
|
$2,168,200
|
$1,500,000
|
$1,121,400
|
$3,029,400
|
|
Minimum
|
$792,400
|
$950,000
|
$0
|
$0
|
$365,300
|
|
Maximum
|
$4,612,800
|
$11,017,300
|
$15,945,500
|
$17,649,500
|
$6,825,000
|
|
Range
|
$3,820,400
|
$10,067,300
|
$15,945,500
|
$17,649,500
|
$6,459,700
|
|
Count
|
21
|
46
|
75
|
50
|
28
|
|
1st Quartile
|
$1,733,500
|
$1,291,700
|
$1,022,600
|
$900,000
|
$1,868,100
|
|
3rd Quartile
|
$3,002,000
|
$3,737,800
|
$3,228,300
|
$3,600,000
|
$4,281,500
|
|
Interquartile Range
|
$1,268,500
|
$2,446,100
|
$2,205,700
|
$2,700,000
|
$2,413,400
|
|
1.00%
|
$792,400
|
$950,000
|
$0
|
$0
|
$365,300
|
|
2.50%
|
$792,400
|
$1,096,200
|
$81,800
|
$0
|
$365,300
|
|
5.00%
|
$1,165,000
|
$1,100,000
|
$430,000
|
$100,000
|
$965,000
|
|
95.00%
|
$3,526,300
|
$5,522,200
|
$10,385,000
|
$5,750,000
|
$5,995,500
|
|
97.50%
|
$4,612,800
|
$5,600,000
|
$14,513,500
|
$6,000,000
|
$6,825,000
|
|
99.00%
|
$4,612,800
|
$11,017,300
|
$15,945,500
|
$17,649,500
|
$6,825,000
|
|
Comp 08 (Industrials)
|
Comp 08 (Oil & Gas)
|
Comp 08 (Technology)
|
Comp 08 (Telecommunications)
|
Comp 08 (Utilities)
|
|
|
One Variable Summary
|
Data Set #1
|
Data Set #1
|
Data Set #1
|
Data Set #1
|
Data Set #1
|
|
|
Mean
|
$2,648,446
|
$3,010,437
|
$2,283,269
|
$3,319,620
|
$2,261,056
|
|
|
Std. Dev.
|
$1,415,705
|
$1,618,410
|
$2,515,800
|
$1,725,552
|
$991,095
|
|
|
Median
|
$2,149,200
|
$2,688,700
|
$1,579,400
|
$3,450,000
|
$2,044,400
|
|
|
Minimum
|
$768,400
|
$307,200
|
$0
|
$1,420,800
|
$0
|
|
|
Maximum
|
$6,024,000
|
$6,191,700
|
$11,693,700
|
$5,840,600
|
$4,468,300
|
|
|
Range
|
$5,255,600
|
$5,884,500
|
$11,693,700
|
$4,419,800
|
$4,468,300
|
|
|
Count
|
69
|
27
|
26
|
5
|
34
|
|
|
1st Quartile
|
$1,452,500
|
$1,716,700
|
$856,700
|
$2,035,300
|
$1,678,000
|
|
|
3rd Quartile
|
$3,760,300
|
$4,420,000
|
$2,469,600
|
$3,851,400
|
$2,913,700
|
|
|
Interquartile Range
|
$2,307,800
|
$2,703,300
|
$1,612,900
|
$1,816,100
|
$1,235,700
|
|
|
1.00%
|
$768,400
|
$307,200
|
$0
|
$1,420,800
|
$0
|
|
|
2.50%
|
$917,500
|
$307,200
|
$0
|
$1,420,800
|
$0
|
|
|
5.00%
|
$945,900
|
$1,298,600
|
$0
|
$1,420,800
|
$791,700
|
|
|
95.00%
|
$5,326,000
|
$5,870,000
|
$7,300,000
|
$5,840,600
|
$3,674,000
|
|
|
97.50%
|
$5,925,800
|
$6,191,700
|
$11,693,700
|
$5,840,600
|
$4,468,300
|
|
|
99.00%
|
$6,024,000
|
$6,191,700
|
$11,693,700
|
$5,840,600
|
$4,468,300
|
|
Q5) Cont'd
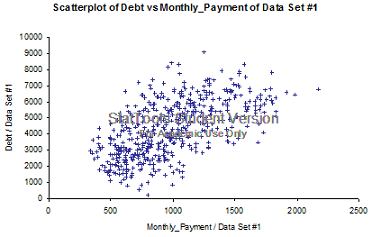
Q6) Interpret the graph shown below. What can you conclude about the relationship between these two variables? This is from the data set shown in sheet Q2.
Attachment:- data_analysis.xls
|
Determining the dupont analysis
: What is its total assets turnover? Round your answer to two decimal places. What is its equity multiplier? Round your answer to two decimal places.
|
|
What are three communication techniques
: What are three communication techniques that you can use to improve project performance? In other words, how can you increase the chances that the project meets the goals and objectives?
|
|
Days sales outstanding
: Baker Brothers has a DSO of 27 days, and its annual sales are $4,745,000. What is its accounts receivable balance? Assume that it uses a 365-day year. Round your answer to the nearest cent.
|
|
Determine the range of vo1
: Determine the range of vO1 for which both N1 and P1 are biased in the saturation region. - If vO2 = 0.6 V, determine the values of vO3, vO1, and vI.
|
|
What is the average salary of the employed internet users
: Examine the data set in the worksheet Q2. This data set lists the 15 players on the 2015-2016roster of the Los Angeles Lakers. The variables include the name, position, and salary for each player.
|
|
What were some of the causes of the stagflations of 1973
: (Stagflation)What were some of the causes of the stagflations of 1973 and 1979? In what ways were these episodes of stagflation different from the Great Depression of the 1930s?
|
|
Discuss the measurement and valuation of provisions
: Discuss the measurement and valuation of provisions and contingent liabilities or contingent assets employed by the chosen company
|
|
End-of-the-year tuition
: Otto is planning for his son's college education to begin ten years from today. He estimates that the end-of-the-year tuition, books, and living expenses to be $10,000 per year for a four-year-degree. How much must Otto deposit today, at an inte..
|
|
Determine the range of vo2
: If vO1 = 0.6 V, determine vI and vO2. - Determine the range of vO2 for which both N2 and P2 are biased in the saturation region.
|