Reference no: EM132249313
Macroeconomic Assignment - Problem Set
Problem 1 - Jones, Chapter 16, Exercises 2, 5, and 6.
Exercises 2 - The neoclassical consumption model, a retirement perspective
Consider the special case solved in the text where β = 1 and utility takes the log form. Suppose the real interest rate is 5 percent. Let's give this consumer a financial profile that might look like that of a middle-aged college professor contemplating retirement: initial assets are ftoday = $50,000, and the path for labor income is ytoday = $100,000 and yfuture = $10,000.
(a) What is the individual's human wealth? Total wealth?
(b) According to the neoclassical model, how much does the college professor consume today and in the future? How much does the college professor save today?
(c) If current labor income rises by $20,000, by how much will saving change?
(d) By how much does consumption today rise if future labor income rises by $10,000?
(e) If the interest rate rises to 10 percent, by how much do total wealth and today's consumption change? By how much does saving change? Why are these effects so much smaller than in exercise 1?
(f) Would it matter if the professor could not borrow?
Exercise 5 - The neoclassical consumption model with log utility and β ≠ 1
With log utility, the solution to the neoclassical consumption model is given implicitly by the two equations on page 446, the Euler equation and the intertemporal budget constraint:
cfuture/ctoday = β(1+R)
ctoday + (cfuture/1+R) = X-.
There, we solved these two equations for ctoday and cfuture in the special case where β = 1. This exercise considers the case where β differs from 1.
(a) Solve these two equations for ctoday and cfuture when β ≠ 1.
(b) Verify that the solution matches what we obtained in the text when β = 1.
(c) When β < 1, is ctoday higher or lower than when β = 1? Why?
Exercise 6 - Ricardian equivalence
Suppose that the government fears the economy might be heading into a recession and decides to cut income taxes today in an effort to prevent the recession.
(a) How does the Ricardian equivalence argument apply in this case? How will consumption respond according to this argument?
(b) How will your answer change if some individuals are borrowing-constrained?
Problem 2 - Andolfatto, Chapter 5, Exercises 5.8, 5.9 and 5.10.
Exercise 5.8: Consider a parameter configuration such that a small open economy is currently running a trade balance deficit. Many governments have in the past implemented capital controls, for example, a legal restriction that prevent foreign agents from purchasing domestic financial assets. Presumably, the idea here is that a trade balance deficit is a 'bad thing,' and that the capital controls will serve to prevent an 'excessive' deficit from occurring. Use the theory developed here to show that while capital controls can successfully reduce (or eliminate) a trade deficit, this is likely to come at the expense of lower economic welfare for domestic agents.
Exercise 5.9: Imagine extending our 2-period model to allow for many time periods T. Consider a shock to current GDP of a given size. Explain why the response of current consumer spending is likely to grow smaller as the time horizon T is made larger.
Exercise 5.10: In a recent article, John Bluedorn investigates how the current account position of small Caribbean and Central American economies react to 'hurricane shocks.' Hurricanes are not infrequent events in these parts of the world. When they hit, they invariably lead to a transitory decline in real per capita GDP (at least, controlling for several other factors). The author finds that the current account position of these economies first falls and later increases in response to a hurricane shock. Is this feature of the data consistent with our theory? Explain.
Problem 3 - Jones, Chapter 18, Exercises 4, 6, 7.
Exercise 4 - The intertemporal budget constraint with three periods: Consider an economy that exists for three periods: period 1, period 2, and period 3. In each period, the government must satisfy the budget constraint Bt+1 = (1 + i)Bt + Gt - Tt.
(a) Write this budget constraint for each period.
(b) What must be true about B4?
(c) Using the result from part (b), solve the period 3 budget constraint for B3, and substitute this back into the period 2 budget constraint.
(d) Solve this new version of the period 2 budget constraint for B2, and substitute the result back into the period 1 budget constraint.
(e) At this point, you should have the intertemporal budget constraint for the three-period economy. Interpret this equation.
Exercise 6 - Ricardian equivalence and the government budget constraint
Consider the intertemporal budget constraint in equation (18.5). Assume the interest rate is i = 5%.
(a) Suppose the government cuts taxes today by $100 billion. Describe three possible ways the government can change spending and taxes to satisfy its budget constraint.
(b) Suppose consumers obey the permanent-income hypothesis (discussed in Chapter 10). Would their consumption rise, fall, or stay the same for each of the alternatives considered in part (a)?
(c) What happens to private saving, total saving, and investment in the three scenarios? Why? (Assume foreign saving does not change.)
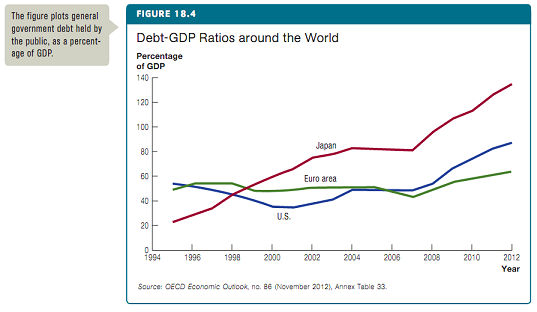
Exercise 7 - Debt-GDP ratios and economic crises
The debt-GDP ratio in Belgium exceeded 120% in the early 1990s and has fallen to just over 80% more recently. Italy had a debt-GDP ratio of about 100% even before the euro crisis. The rapid rise in Japan's debt-GDP ratio was shown in Figure 18.4. Yet none of these economies experienced defaults or high inflation. In contrast, the debt-GDP ratio in Argentina peaked at 65% (up from 35% in 1996) and then a crisis struck, leading to default and other macroeconomic problems. How, broadly speaking, do we understand these very different outcomes?
Problem 4 - Using the FRED database, create a graph (or graphs) of the government debt-to-GDP ratio in Canda, China, India, and the USA (GGGDTACAA188N, GGGDTACNA188N, GGGDTAINA188N, GGGDTAUSA188N).
(a) Display the graph (or graphs).
(b) What is the average debt-to-GDP ratio in each country for the most recent 5 years of data? Which country had the lowest? The highest?
(c) Can you see any trends? How would you explain them?
Textbooks -
1. MACROECONOMICS, Third Edition by Charles I. Jones. ISBN 978-0-393-92390-2.
2. MACROECONOMIC THEORY & POLICY, 2nd Edition by David Andolfatto.