What is his total utility after eating each piece

Assignment Help Microeconomics
Reference no: EM131019841

Homework #3

1. In 2005, the nominal wage per hour was $10 in Japan and $6 in South Korea. In the same year, the CPI in Japan was 100, and the CPI in South Korea was 50. Evaluate the following statements and argue whether they are true or false.

a. In 2005, the real wage in South Korea was lower than in Japan.
b. In 2005, the real wage in South Korea was higher than in Japan.
c. The real wages in both countries were the same in 2005.
d. The nominal wages in both countries were the same in 2005.

2. Jerry is at a party where free pizza is being provided. The following table gives the marginal utility that Jerry gets from eating each piece of pizza.

Pieces of Pizza

Marginal Utility

Total Utility

0

0


1

20


2

15


3

10


4

5


5

-5


6

-10


a. What is his total utility after eating each piece?

b. Assuming Jerry can only consume whole pieces of pizza (in that he is not allowed to eat a fraction of a piece), how many pieces would Jerry choose to eat?

3. Fred consumes only bread (measured in loaves of bread) and soda (measured in cans of soda). The following points give 3 of his indifference curves for consumption in a given week.

Indifference Curve A


Indifference Curve B


Indifference Curve C

Bread

Soda


Bread

Soda


Bread

Soda

1

10


1

15


1

6

2

6


2

10


2

4

5

4


4

9


3

3

6

4


7

8


6

2

a. Plot these three indifference curves on the same graph with bread on the x-axis and soda on the y-axis. Which indifference curve represents the highest level of utility?

b. Soda costs $1 per can and bread costs $1 a loaf. Fred has $12 to spend on these goods each week. Derive his budget line and plot it on your graph.

c. Given the three indifference curves and the budget line, what is Fred's optimal choice of soda and bread? What is the marginal rate of substitution at this bundle? Why?

d. Now suppose the price of bread increases to $3 a loaf.

i. Draw the new budget line.

ii. What is his optimal consumption now?

iii. By how much did his soda consumption change?

iv. On your graph, identify the change in soda consumption caused by the income effect. Draw the change in soda consumption from the substitution effect.

v. Did the income effect or substitution effect play a stronger role in his decision on how much soda to consume?

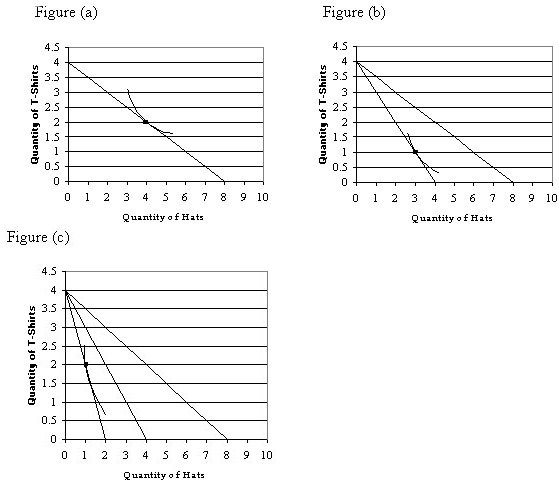
4. Peter has $320 to spend on either T-Shirts or hats. Figures (a), (b), and (c) show Peter's consumption when he is facing different price levels. Derive and draw Peter's demand curve for hats.
963_Draw Peters demand curve for hats.jpg

Reference no: EM131019841

Questions Cloud

How will you avoid those potential problems : What technical, legal, privacy, accessibility, and usability issues could your website face and how will you avoid those potential problems?
Importance to a person selecting a retirement plan : What other summaries of the mutual fund's rate of return are of importance to a person selecting a retirement plan?
Construct the rejection region for testing : A researcher selects a random sample of 30 units from a population having a median M. Construct the rejection region for testing the research hypothesis Ha: M > M0 using a = .01 and values in Table 4 of the Appendix.
How many liters of the orange juice should be in the mixture : How many liters of the 25% orange juice should be in the mixture? How many liters of the 5% orange juice should be in the mixture?
What is his total utility after eating each piece : What is his total utility after eating each piece - identify the change in soda consumption caused by the income effect. Draw the change in soda consumption from the substitution effect.
Measurements from a population having population median : Suppose we have a random sample of n = 45 measurements from a population having population median M. The research design calls for a 95% confidence interval on M. a. Use Table 4 in the Appendix to obtain La2 and Ua2.
What is the total market quantity produced in this market : In the long run, how many units will this firm produce and what price will it sell each unit for in this market?  What is the total market quantity produced in this market in the long run
Measurements from population having population median : Suppose we have a random sample of n = 15 measurements from a population having population median M. The research design calls for a 95% confidence interval on M.
Describe at least two additional pieces of information : The term cultural competence denotes an integrative perspective on the cultures of other people. Individuals displaying higher levels of cultural competency tend not to promote their culture over others or vice versa-they instead demonstrate an in..

Reviews

Write a Review

Microeconomics Questions & Answers

  The free rider problem

Question: Explain why the free rider problem makes it difficult for perfectly competitive markets to provide the Pareto efficient level of a public good.

  Failure of the super committee is good thing for economy

Some commentators have argued that the failure of the “Super committee” is good thing for the economy?  Do you agree?

  Case study analysis about optimum resource allocation

Case study analysis about optimum resource allocation: -  Why might you suspect (even without evidence) that the economy might not be able to produce all the schools and clinics the Ministers want? What constraints are there on an economy's productio..

  Fixed cost and vairiable cost

Questions:  :   Which of the following are likely to be fixed costs and which variable costs for a chocolate factory over the course of a month?  Explain your choice.

  Problem - total cost, average cost, marginal cost

Problem - Total Cost, Average Cost, Marginal Cost: -  Complete the following table of costs for a firm.  (Note: enter the figures in the  MC   column  between  outputs of  0 and 1, 1 and 2, 2 and 3, etc.)

  Oligopoly and demand curve problem

Problem based on Oligopoly and demand curve,  Draw and explain the demand curve facing each firm, and given this demand curve, does this mean that firms in the jeans industry do or do not compete against one another?

  Impact of external costs on resource allocation

Explain the impact of external costs and external benefits on resource allocation;  Why are public goods not produced in sufficient quantities by private markets?  Which of the following are examples of public goods (or services)? Delete the incorrec..

  Shifts in demand and movements along the demand curve

Describe the differences between shifts in demand and movements along the demand curve. What are the main factors which can shift the demand curve? Explain why they cause the demand curve to shift. Use examples and draw graphs to support your discuss..

  Article review question

Article Review Question: Read the following excerpts from the article "Fruit, veg costs surge' by Todd, Dagwell, published in the Herald on January 25th 2011 and answer questions below:

  Long-term growth, international trade & globalization

Long-term Growth, International Trade & Globalization:- This question deals with concepts such as long-term growth, international trade and globalization. Questions related to trade deficit, trade surplus, gains from trade, an international trade sce..

  European monetary union (emu) in crisis

"Does the economic bailout of Spain and Greece spell the beginning of the end for the European Monetary Union (EMU)?"

  Development game “settlers of catan”

Read the rules of the game, the overview and the almanac for the Development Game "Settlers of Catan"

Free Assignment Quote

Assured A++ Grade

Get guaranteed satisfaction & time on delivery in every assignment order you paid with us! We ensure premium quality solution document along with free turntin report!

All rights reserved! Copyrights ©2019-2020 ExpertsMind IT Educational Pvt Ltd