Reference no: EM131073692
Lab- The Fourier Series and Fourier Transform
• Perform activity below for the lab assignment using MATLAB.
• Include answers for Problems and include MATLAB coding along with any output plots that support solutions into a Word document entitled "Lab5_StudentID". Where your student id is substituted in the file name.
• Upload file "Lab5_StudentID".
Activity:
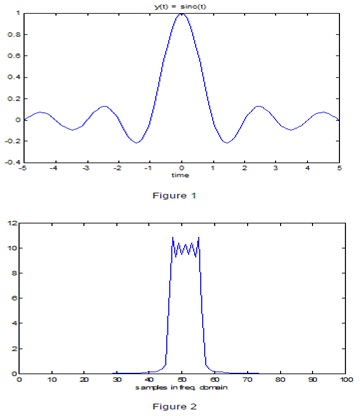
A continuous time function is shown below in figure 1. This signal is a sinc function defined as y(t) = sinc(t). The Fourier transform of this signal is a rectangle function.
1. Use the function linspace to create a vector of time values from -5 ≤ t ≤ 5. Next, plot the function shown in figure 1 using the sinc function for y(t) = sinc(t).
2. Using Matlab and the command fft, show that the Fourier transform pair is indeed a rectangle function. Use the command fftshift to center your plot. Don't forget that the Fourier transform is complex, with both magnitude and phase. Your result should be the same as figure 2. Show both your m-file code and plot.

Matlab tip: The following commands are useful when working with the Fourier transform:
abs gives the magnitude of a complex number (or absolute value of a real number)
angle gives the angle of a complex number, in radians
[Note: The fft command does not give the exact transform for a continuous time signal, which we have in this case. For instance, the magnitude will not be correct. However, in order to obtain the general shape including relative magnitudes, it can be quite useful.]
1. Using the same time values, plot the continuous time function defined as y(t) = sinc(2t).
2. Plot the transform pair for this signal.
Questions:
1. What is the cause of the "ringing" seen on top of the rectangular pulse shown in figure 2?
2. In step 3 above, the sinc function gets compressed by a factor of 2, as seen by comparing the graphs in the time domain. What happened to the rectangular pulse in the frequency domain? What property does this represent?
|
The marginal tax rate on wage income fell dramatically
: During the Reagan administration, the marginal tax rate on wage income fell dramatically. Forexample, the top rate was sliced from 70 to 33 percent. Use the demand theory of healthinsurance to predict the effect of this change on the quantity demande..
|
|
Passing variables between functions
: What is a logical use for global variables? The choices are: 1. You don't have to keep passing variables between functions.
|
|
What does it mean to say a variable is local to a function
: What does it mean to say a variable is local to a function? The choices are: 1. Main() can use it whenever it wants to, but no other functions can see or use it.
|
|
The economy is no longer in an equilibrium
: Comment on the following statement: “When aggregate demand falls below the current output level, an unintended inventory accumulation occurs and the economy is no longer in an equilibrium.”
|
|
What is cause of ringing seen on top of rectangular pulse
: What is the cause of the "ringing" seen on top of the rectangular pulse shown in figure 2? What happened to the rectangular pulse in the frequency domain? What property does this represent?
|
|
Appropriate level-writer analyzes and synthesizes theory
: Imagine that you and a group of your fellow classmates own a company that manufactures cheap sunglasses. To lower production costs, you want to move your factory from your developed country to a more cost-effective nation. At an appropriate level, th..
|
|
Positive and negative incentives for compliance
: Class, there are both positive and negative incentives for compliance; we have talked primarily about negative incentives (fines, negilgence lawsuits, jail time).
|
|
Computer maintains memory alignment
: Part a) A computer maintains memory alignment. At what addresses can we store a byte variable? What about a 16-bit variable? Part b) A computer maintains memory alignment. Show how the variables below are stored in the memory if they have to be sto..
|
|
Examine the fate of nox as the air parcel ages
: Consider an air parcel ventilated from a city at time t=0 and subsequently transported for 10 days without exchanging air with its surroundings. The air parcel contains initially 100 ppb NOx. We wish to examine the fate of NOx as the air parcel ag..
|