Reference no: EM133029386
Assignment applied spectroscopy
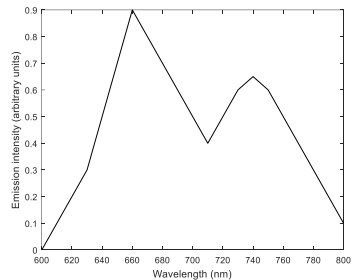
Question 1 The emission spectrum, see below, has two broad peaks and was recorded with an continuously exciting light source. The dilute aqueous solution was placed in a glass cuvette and light was collected perpendicular to the excitation beam. The 660/740 nm peak is associated with emission for the lowest excited singlet/triplet state. The lifetimes of the singlet and triplet states were measured to be 5 nanoseconds and 5 microseconds respectively. Plot the emission spectrum when the exciting light source has a 1 nanosecond pulse width with a 1,000 Hz repetition frequency, for the following two cases; a) the detector samples for 10 nanoseconds starting 1 nanosecond after the exciting pulse b) the detector samples for 10 microseconds starting 1 microsecond after the exciting pulse. Show example calculations used to generate spectral plots. In the design of molecules, heavy atoms such as platinum or ruthenium are sometimes added to increase the spin-orbit coupling to increase the rate of conversion from singlet to triplet state. Sketch the shape of the emission spectrum (for continuous excitation) if spin orbit coupling has been doubled. Explain the spectral change.
Question 2 Topical photodynamic therapy with 5-amino-levulinic acid (ALA) is used to treat skin cancers at the London Regional Cancer Program. In the mitochondria of cells ALA is converted to protoporphyrin IX. Cell death occurs after a threshold number of singlet oxygen molecules are generated.
2a) Sketch and label an energy level diagram of the photodynamic process.
2b) During ALA photodynamic therapy photobleaching of protoporphyrin IX occurs due to oxidation by singlet oxygen. What happens to the treatment efficiency? If the blood vessels are damaged by the treatment and blood flow stops, what happens to the photobleaching rate?
Without blood flow, what happens to the tissue?
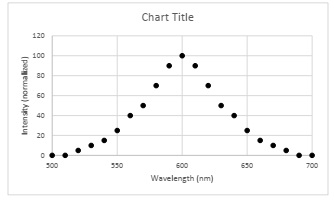
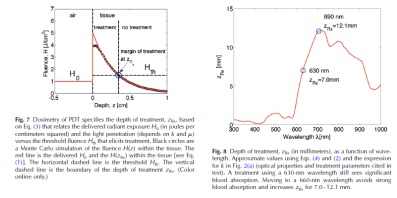
Question 3 a) The emission spectrum of a dye molecule in solution is shown below and light penetration depth in tissue in attached figure 8. Plot measured emission spectrum if a thin layer of cells located at 0.1, 1 and 5mm depths stained with the dye. Assume a monochromatic excitation source and the excitation intensity adjusted to deliver the same number of photons to the cell layer. Describe calculation for plots, include sketch of measurement geometry.
b) At high concentrations hydrogen peroxide applied topically will temporarily whiten skin due to decreased blood flow. For the case of the stained cell layer at 1 mm depth in tissue, what changes in the measured emission spectrum are observed? Hint refer to composite plot of optical window in lecture slides.