Reference no: EM131025174
1. This question is designed to evaluate your recall of basic supply and demand principles. For each of the following sketch a diagram of supply and demand. Assume each market is initially in equilibrium before the stated event occurs. Draw this initial equilibrium and the subsequent equilibrium after the market adjusts. Provide a summary statement about the effect of the stated event on the equilibrium price and quantity. Label your graphs with the following notation where appropriate:
D1 = the initial demand curve
D2 = the new demand curve
S1 = the initial supply curve
S2 = the new supply curve
P1 = the initial equilibrium price
P2 = the new equilibrium price
Q1 = the initial equilibrium quantity
Q2 = the new equilibrium quantity
a. The cost of labor increases for all firms in an industry. At the same time income increases for consumers. Assume this good is a normal good.
b. The price of steak increases. What is the effect of this price change on the market for chicken?
c. The government taxes producers of the good with an excise tax that is an amount levied on each unit of the good sold. On your graph label the price paid by consumers as P2, and the price received by producers (this price excludes the excise tax they pay the government) as P3.
2. Suppose that the production function for an economy is given by
Y = F(K,L) = AK1/2L1/2
Where Y is output, A is the level of technology, K is capital and L is labor.
a. If the value of L is 100, the value of K is 400, and the value of A is 2, what is the value of output in this economy? Show your work.
b. Given the values in part (a), calculate labor productivity. Show your work. Be sure to show the relevant units of measurement in your answer.
c. If capital and technology are held constant, but labor is decreased to 81 units, what happens to labor productivity? Verbally describe the effect of this change on labor productivity.
d. In the space below sketch a picture that shows the aggregate production function drawn with respect to labor. In your drawing indicate both the initial situation where labor equals 100 and the new situation where labor equals 81. Label your graph carefully and completely. On your drawing indicate what is happening to labor productivity as you move from using 100 units of labor to using 81 units of labor.
3. This is just a quick review of some terms I think you should be familiar with before we start the course. The diagram below illustrates an aggregate production function showing the relationship between the amount of capital utilized in a year by an economy and the level of real GDP this economy produces in a year from that capital. The aggregate production function that is represented is drawn holding the level of labor and technology constant.
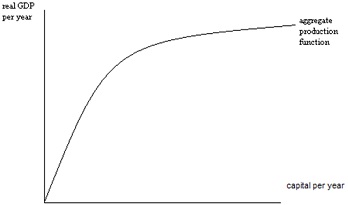
a. Using the graph as a reference, what is the marginal product of capital?
b. Using the graph as a reference, what is capital productivity?
c. Suppose the level of technology changes in this economy. In the space below sketch a graph of the aggregate production function and how it is affected by this change.
|
One of the disadvantage of pass by reference
: One of the disadvantage of pass by reference is that the called function may inadvertently corrupt the called data. How ca this be avoided?
|
|
Prepare a consolidated balance sheet worksheet
: Power Company owns 90 percent of Pleasantdale Dairy’s stock. The balance sheets of the two companies immediately after the Pleasantdale acquisition showed the following amounts.
|
|
How to cite the source in your paper using apa style
: You would like to integrate this article into your paper. Which of the following is a correct example of how to cite this source in your paper using APA style?
|
|
Convert degrees celsius to fahrenheit
: A c++ program with two functions: The first function converts degrees Celsius to Fahrenheit, the second function converts Fahrenheit to degrees Celsius. The user should be prompted to choose two options;- "1. Convert degrees Celsius to Fahrenheit"
|
|
What happens to labor productivity
: If the value of L is 100, the value of K is 400, and the value of A is 2, what is the value of output in this economy? Show your work.
|
|
How can be two different reaction pathways for same reaction
: The following graph shows two different reaction pathways for the same overall reaction at the same temperature. Which pathway is slower? Why? How can there be two different reaction pathways for the same reaction at the same temperature? Discuss.
|
|
What fraction of reactant remains
: Given the following diagrams at t = 0 min and t = 30 min, what is the half-life of the reaction if it follows first-order kinetics? After four half-life periods for a first-order reaction, what fraction of reactant remains?
|
|
What accounts for the difference in these two graphs
: A friend studies a first-order reaction and obtains the following three graphs for experiments done at two different temperatures. Which two graphs represent experiments done at the same temperature? What accounts for the difference in these two gr..
|
|
The balance of an unearned revenue account
: The balance of an unearned revenue account:a.Appears in the balance sheet as a component of owners' equity.b.Appears in the income statement along with other revenue accounts.c.Appears in a separate section of the income statement for revenue not yet..
|