Reference no: EM13856490
Part I:
End-of-chapter problems:
• the following questions.
• If applicable, remember to show work in your homework document for partial credit.
1) What are the 6 steps of hypothesis testing?
2) Using the z table in Appendix B, calculate the following percentages for a z score of -0.29
2-a) % above this z score:
2-b) % below this z score:
2-c) At least as extreme as this z score (on either side):
3) Rewrite each of the following percentages as probabilities, or p levels:
4) If the critical values, or cutoffs, for a two-tailed z test are -2.17 and +2.17, determine whether you would reject or fail to reject the null hypothesis in each of the following cases:
4a) z = -0.87
4b) z = 2.19
5) Imagine a class of twenty-five 12-year-old girls with an average height of 62 inches. We know that the population mean and standard deviation for this age group of girls is m=59 inches, s = 2.5 inches. (Note that this is a z statistic problem.)
5a) Calculate the z statistic for this sample.
5b) How does this sample mean compare to the distribution of sample means? In other words, how does the height of the girls in the sample compare to the height of girls in the general population?
6) For the following scenarios, identify whether the researcher has expressed a directional or a nondirectional hypothesis:
6a) Cell phones have changed the levels of closeness in long-distance relationships.
6b) A professor wonders whether students who eat a healthy breakfast score better on exams in morning courses than those who do not eat a healthy breakfast.
For the following scenario, state the null and research hypotheses in both words and symbolic notation. Symbolic notation must include the symbols "μ1" and "μ2" and a comparison operator (=, ≠, <, >, ≤, ≥), as described in Nolan and Heinzen (2014). Remember to consider whether the hypothesis is nondirectional or directional.
Scenario: A professor wonders whether students who eat a healthy breakfast score better on exams in morning courses than those who do not eat a healthy breakfast.
Null Hypothesis (H0): Symbolic Notation
Null Hypothesis:
Written Statement
Research Hypothesis (H1): Symbolic Notation
Research Hypothesis:
Written Statement
Part I: Questions 8a-8g
Fill in the highlighted blanks with the best word or words
Values of a test statistic beyond which you reject the null hypothesis are called ________.
The ________ is the area in the tails in which the null can be rejected.
The probability used to determine the critical values, or cutoffs, in hypothesis testing is known as a ________ level, also known as alpha.
If your data differ from what you would expect if chance were the only thing operating, you would call your finding ________.
A hypothesis test in which the research hypothesis is directional is a(n) ________ test.
A hypothesis test in which the research hypothesis specifies that there will be a difference but does not specify the direction of that difference is a(n) ________ test.
If your z-statistic exceeds the critical cutoff, you can ________ the null hypothesis.
Part I:
The police department of a major city has found that the average height of their 1,050 officers is 70 inches (μ = 70 in.) with σ = 2.5 inches. Use the normal distribution and the formulas and steps in this week's presentations to the following questions:

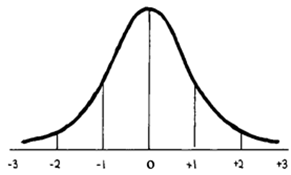
Note: Showing work is required for this section. Remember that it helps to transfer the raw mean and SD from the description above to the standardized curve shown here (though you don't need to show this). This helps compare raw and z scores and check your work.
10 a) What is the z score for an officer who is 72 inches tall? Based on the z score and the z table, what is the officer's percentile?
10 b) What is the height (in inches) that marks the 75th percentile for this group of officers?
10 c) What percent of officers are between 65 and 72 inches tall?
Part I: Questions 11a-11c
The verbal part of the Graduate Record Exam (GRE) has a μ of 500 and σ = 100. Use the normal distribution and the formulas and steps in this week's presentations to the following questions:

11a) What is the z score for a GRE score of 597? What is the percentile rank of this z score?
11b) What GRE score corresponds to a percentile rank of 18%?
11c) If you wanted to select only students at or above the 87th percentile, what GRE score would you use as a cutoff score (i.e. what GRE score corresponds to this percentile)?
Part II: SPSS Analysis
• Using the z-scored IQ variable, create percentile ranks assuming the scores are normally distributed.
o Call the new percentile variable "IQ rank."
1a) List the first 5 IQ ranks from your file (rows 1-5).
1b) Which raw IQ score seems to best divide the top 50% from the bottom 50% of scores?
(This score can be found by looking carefully over the values in the IQ rank column)
Part IV: (Non-SPSS)
For a distribution with M = 35 and s = 7:
1) What is the z-score corresponding to a raw score of 21?
2) What is the z-score corresponding to a raw score of 39?
3) If a person has a z-score of 1.7, what is his/her raw score?
4) If a person has a z-score of -.62, what is his/her raw score?
Part IV:
Question 5-8
For the following types of data, state the graph that would be the best choice to display the data.
Two items have more than one correct -for these, either is acceptable.
A nominal independent variable (IV) and a scale dependent variable (DV)
Answer
One scale variable with frequencies (when you want to see the general shape of the distribution).
Answer
One scale IV and one scale DV
Answer
One nominal variable broken down into percentages