Reference no: EM13884897
1. Please read the following narrative and answer the following questions:
Researchers compared urinary bacteria levels of elderly women who drank 10 ounces of a juice drink containing cranberry juice each day to elderly women who consumed the same amount of a look-alike drink without cranberry juice (indistinguishable in taste, appearance, and vitamin C content from cranberry juice). 153 elderly women participated in this study. Each one was randomly assigned to the cranberry juice group or the placebo group and was followed over a 6-month period. The women had a mean age of 78.5 years and high levels of bacteria in their urine at the start of the study. The odds in the cranberry group of having bacteria levels exceeding a certain threshold were 42% of what they were in the control group.
a. What can you conclude, based on this research, about cranberry juice and urinary tract bacteria?
b. The lead researcher is quoted as saying "This is the first demonstration that cranberry juice can reduce the presence of bacteria in the urine in humans." This implies that the results apply to all humans and is a bit of an overgeneralization of the results. What is a more appropriate conclusion, based on this study?
2. The regression equation measures
a. how far the sample mean deviates from the population mean
b. how far each data point deviates from the line that most closely fits the data
c. how significant mean differences are between groups
d. how often scores regress from deviations in the data
3. Multiple regression is a statistical method that includes ____ predictor variable(s) in the equation of the regression line.
a. zero
b. one
c. two
d. two or more
4. A researcher reports the following equation for a best-fitting straight line to a set of data points:Ý=0.48X + 12.03. What is the value for the slope?
a. Ý
b. 0.48
c. 12.03
d. the slope is not given in this equation
5. A researcher measures the extent to which the speed at which people eat (in minutes) predicts calorie intake (in kilocalories). Which factor is the predictor variable in this example?
a. the speed at which people eat
b. calorie intake
c. minutes and kilocalories
d. all of the above
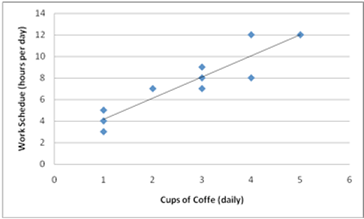
6. A researcher measures the following correlation between cups of coffee consumed daily and daily work schedule. Which description best explains the relationship between these two factors?

a. The more a person works, the more coffee he or she tends to drink.
b. The less a person works, the more coffee he or she tends to drink.
c. The more a person works, the less coffee he or she tends to drink.
d. No linear pattern is evident.
7. To summarize correlations, we report:
a. the strength of the correlation
b. the direction of the correlation
c. the p value
d. all of the above
8. True or False: Correlation does not show causation.
9. Outliers can change the _____ of a correlation.
a. direction
b. strength
c. sign (+, -)
d. all of the above
10. True or False: A positive correlation is always stronger than a negative correlation.
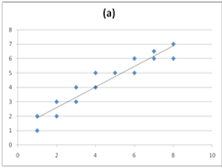
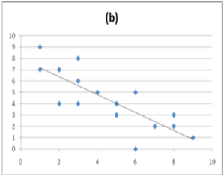
11. The following graphs display the data points for two linear correlations. Based on the information provided in these graphs, ________ displays a negative correlation and ________ displays a stronger correlation.


a. Graph A; Graph B
b. Graph B; Graph A
c. Graph A; Graph A
d. Graph B; Graph B
12. True or False: If the coefficient of determination is 0.09 and the sum of squares regression is 88, then the total variation in Y must be SSy= 108.
13. True or False: Including two or more predictor variables into a single equation of a regression line can be more informative than an analysis using only one predictor variable.
14. You are taking a class with a large number of students. The professor notes that the midterm exam scores were bell-shaped but doesn't tell you the mean. You take a random sample of 10 students and construct a 95% confidence interval for the mean exam score. Now the professor wants to give everyone 5 extra points on the exam. How will your confidence interval change?
a. The sample mean will increase by 5 points and the margin of error will also.
b. The sample mean will increase by 5 points but the margin of error will stay the same.
c. The sample mean will stay the same but the margin of error will increase by 5 points.
d. Both the sample mean and the margin of error will remain unchanged.
15. The standard deviation of all possible sample means (from same sized samples) is called the ______ of the mean.
16. For a 95% confidence interval, the value of 95% is called the ____________.
17. A confidence level is a measure of how much confidence we have that the _________ we used to generate the interval worked.
18. When a relationship or value from a sample is so strong that we can effectively rule out chance as an explanation, we say that the result is ____________.
19. Which of the following statements is true regarding the relationship between a Type I and Type II error in a given situation?
a. Their probabilities add up to 1.
b. A Type II error is two times as large as its corresponding Type I error.
c. As the probability of one of them increases, the probability of the other one decreases.
d. All of the above.
20. Which of the following is true when a Type I error has been committed?
a. The null hypothesis has to have been true.
b. The data must have convinced us that the alternative hypothesis was true.
c. The probability of making a Type I error is equal to the stated level of significance, usually .05.
d. All of the above.
21. Making a Type I error is only possible if the hypothesis is true. Making a Type II error is only possible if the hypothesis is true.
22. What is the relationship between the power of a test and the types of errors you can make?
a. The power of a test is equal to 1 minus the probability of a Type II error.
b. The power of a test is equal to the sum of the probabilities of a Type I and Type II error.
c. The power of a test is equal to 1 minus the probability of a Type I error.
d. There is no relationship between power and Type I or Type II errors.
23. Name the two basic techniques researchers use to summarize and draw conclusions about a population based on their statistical results from a sample.
24. A researcher reports the following regression equation for two variables x and y. Ý = 5.10x - 1.50.. If X = 2.30, then what is the value of y?
25. A researcher measures the relationship between narcissism and willingness to help. If SSxy = 240,SSx = 320, and SSy=410, what is the value of the correlation coefficient?