Reference no: EM131276161
Lab Assignment
Title: Lichens as Indicators for Air Quality
Lab Purpose: To survey the diversity of lichens on trees at different locations on campus to determine if their distribution can provide insight into the air quality standards. Lichens can be used as bio-indicators of air quality because they are sensitive to atmospheric pollution, including heavy metals, radiation, and ozone. Specifically we shall test the hypothesis that the abundance and diversity of lichens will be lower in areas exposed to greater air pollutants (major roads and parking lots).
Directions: The class will be split into 6 groups. Each group will hand in a single report at the completion of this lab. Each group will be assigned a different region of the campus to sample lichens that grow on the trees in their designated area. Groups will be given sample containers to collect all the different species of lichens found in their area. Collections will be brought back to the lab for analysis.
Field Procedure: Each Group will be given the following equipment for their analysis.
• 0.25m2 quadrat
• 15-20 small sandwich bags
• Sharpie or pen
• Small spatula or razor blade
• Tree identification guide book
Each group should have one person with a notebook for taking notes and data.
At your designated area, make a general description of your environment and any visible factors that you feel could contribute to air quality standards (smoke stacks, parking lot, etc.). Locate five different trees and try to identify them to species. If you are unable to identify the species, just describe its features. For each tree, place the 0.25m2 quadrat at a height of about 1.5 m (chest height). Within the span of the quadrat, record the percent cover crustose lichen, foliose lichen, fruticose lichen, moss, bare bark, and other (see Instructor for demonstration).
Using your spatula or razor blade, try to collect one specimen from each of the different species of lichens found in your study area. DO NOT COLLECT LICHENS ON A PART OF THE TREE NOT WITHIN THE SPAN OF THE 0.25M2 QUADRAT. Place each specimen in a sandwich bag and label the bag by designated area and order found (i.e. Area C, Tree #3). Return to the lab room for data anlalysis.
Back In the Lab: For each tree, find the mean coverage of crustose lichen, foliose lichen, and fruticose lichen, based on your four coverage counts. From this data, sum the means for the three types of lichen to get a lichen cover percentage for all the trees in your designated area. Compare your results with the other group's data. Finally, estimate the total number of lichen species found in your designated area and compare that with the rest of the groups.
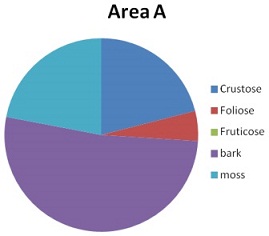
Data Analysis: Using the data from the entire class, make a pie chart for each map area for the mean percent coverage of the three types of lichen. See example below.
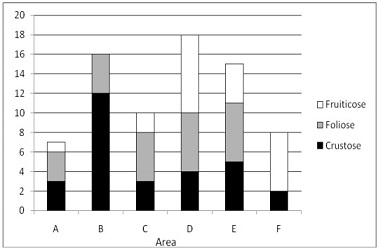
Also, make a bar graph that represents that total number of lichen species found in each different area. Each bar should be divided into the three lichen types. See example below.
Discussion: Make a statement that either supports or refutes the hypothesis of this study. What data or evidence do you feel backs up your groups conclusion and explain your reasoning.
Make sure you identify specific data points and how exactly they support your conclusion. What suggestions would you recommend for improving the scientific merit of the study? What avenues of further investigation would your group suggest?
Completed Report: Remember that each person will submit a report in your online Journal in Blackboard. Each report must have:
1. a title
2. a short descriptive Introduction with purpose statement in your own words. You also need a hypothesis statement (see Lab Purpose above for detail)
3. a Results section with data analysis page with a pie chart and bar graph as described above (graph paper or computer can be used), and
4. a conclusion statement as described above.
|
Emotional intelligence can improve leader effectiveness
: Next, detail the significant ways that an awareness of emotional intelligence can improve a leader’s effectiveness. Select a situation in which you demonstrated emotional intelligence that improved your effectiveness as a leader, either in your profe..
|
|
What are the rising falling and average logical efforts
: Simulate a pseudo-nMOS inverter in which the pMOS transistor is half the width of the nMOS transistor. What are the rising, falling, and average logical efforts? What is VOL?
|
|
Briefly discuss the design methodology
: Briefly discuss the design methodology (or product life cycle) as implemented in your company? Do the engineers believe in it and do they follow it? If yes, why? If not, why not? What suggestions you might have to change or improve and why?
|
|
Compute the appropriate reorder point
: Beauty and The Beatz (B&B) sells and installs car audio systems. The weekly demand for car audio systems follows a normal distribution with mean 70 systems per week and standard deviation 55 systems per week.? B&B reviews its inventory every 14 days...
|
|
What avenues of further investigation would group suggest
: Make sure you identify specific data points and how exactly they support your conclusion. What suggestions would you recommend for improving the scientific merit of the study? What avenues of further investigation would your group suggest?
|
|
Percentage of the financial records of carter health system
: A fire destroyed a large percentage of the financial records of the Carter Health System. You have the task of piecing together information to prepare a financial report. You have found the profit margin to be 5.4 percent. If sales were $4 million on..
|
|
Which accounts are notably different than in prior situation
: How does this affect the pro forma balance sheet? Which accounts are notably different than in the prior situations?
|
|
Design a 4-input footed dynamic nand gate driving
: Design a 4-input footed dynamic NAND gate driving an electrical effort of 1. Estimate the worst charge-sharing noise as a fraction of VDD assuming that diffusion capacitance on uncontacted nodes is about half of gate capacitance and on contacted n..
|
|
Explain main errors that undermine and interview usefulness
: List and explain main errors that undermine and interview's usefulness. Define a structured situational interview and give examples of situational questions, behavioral questions, and background questions that provide structure.
|