Reference no: EM131384494
Management is interested in increasing the efficiency of processing purchase orders. The time to process purchase orders, in days, was observed for 31 randomly selected customers and is shown in given Table. Following a detailed study of the process, certain recommendations were adopted. Twenty-six customers were randomly selected and their purchase order processing times are shown after the process improvement changes.
(a) Find the mean, standard deviation, skew ness coefficient, kurtosis coefficient, and interquartile range of the processing time prior to process changes and comment on the values.
(b) Find the mean, standard deviation, skew ness coefficient, kurtosis coefficient, and interquartile range of the processing time after the process changes and comment on the values.
(c) Find a 95% confidence interval for the mean processing time prior to process changes.
(d) Can we conclude that the mean processing time, before the process changes, is less than 10.5 days? Use α = 0.02. What is the p-value? If α = 0.10, what is your decision? What does this imply?
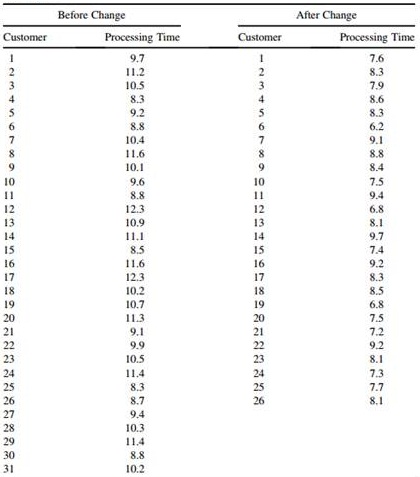
(e) Can we conclude that the mean processing time, after the process changes, is less than 8.5 days? Use α = 0.05. What is the p-value? Explain.
(f) Is there a difference in the variabilities of processing times before and after process changes? Use α = 0.05.
(g) Can we conclude that the process changes have been effective in reducing the mean processing time? Use α = 0.05. What assumptions do you need to make for conducting the test?
|
Write an expression for the pdf of these errors
: what is the mean and standard deviation of the error distribution that results? Write an expression for the pdf of these errors?
|
|
Write an expression for the pdf of these measurements
: A series of 100 measurements is made on the output of an opamp circuit whereby the distribution was found to be Gaussian with mean value of 12.5 mV and a standard deviation of 10 mV. Write an expression for the pdf of these measurements?
|
|
What is the measurement uncertainty of this meter
: A meter is rated at 8-bits and has a full-scale range of ±5 V. What is the measurement uncertainty of this meter, assuming only quantization errors from an ideal meter ADC?
|
|
What is the average measured value
: A 5-mV signal is measured with a meter 10 times, resulting in the following sequence of readings: 5 mV, 6 mV, 9 mV, 8 mV, 4 mV, 7 mV, 5 mV, 7 mV, 8 mV, 11 mV. What is the average measured value? What is the systematic error?
|
|
What assumptions do you need to make for conducting the test
: Find the mean, standard deviation, skew ness coefficient, kurtosis coefficient, and interquartile range of the processing time after the process changes and comment on the values.
|
|
List all possible ideal output levels
: The internal operation of the ADC is such that all code widths are equal. Also, the input digital signal is formatted using a unsigned binary number representation. List all possible ideal output levels. What is the LSB step size?
|
|
Compute the dnl curve for this dac
: The ideal DAC output at code 0 is 0 V and the ideal gain is equal to 400 mV/bit. Answer the following questions assuming an endpoint-to-endpoint line is used as a reference.
|
|
What premium should company charge to make an average
: Ignoring all other losses, what premium should the company charge to make an average net profit of 1.5% of the policy's face value?
|
|
What is the lsb step size
: A 4-bit ADC has a full-scale voltage range of 10 to 10 V. The internal operation of the ADC is based on truncation and the input digital signal is formatted using a two's complement binary number representation. List all possible ideal output leve..
|