Reference no: EM131117518
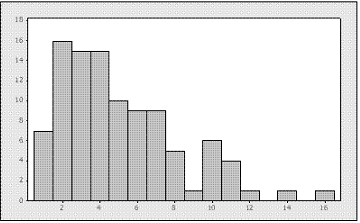
1. From the histogram above, which of the following would we expect to be true?
A. The median would be less than the mean
B. The median would be greater than the mean
C. The median would be equal with the mean
2. Which one of the following variables is discrete?
A. The number of automobiles produced by Ford
B. The daily high temperature in Chicago
C. The age of the students in our class
D. The weight of the students in our class
E. The manufacturer of an automobile
3. A magazine publisher asks readers to log onto their website and vote on a topic. The website allows visitors to select one of two choices and submit a vote. The results of the poll are reported in the next issue of the magazine. The population to which the results of these polls can be extended is:
A. Only readers who voted in that specific poll.
B. All readers of the magazine.
C. All visitors to the website.
D. All readers who have voted in any of the polls.
4. A six-sided die is made that has four Green sides and two Red sides. Any side is equally likely to land face up when the die is tossed. The die is tossed three times. Which of these sequences (in the order shown) has the highest probability
A. Green, Green, Green
B. Red, Red, Red
C. Green, Green, Red
D. Green, Red, Green
5. The sample mean is an estimate of:
A. The average value in the population
B. The average value in the sample
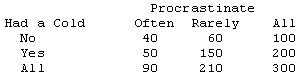
A study found that students who procrastinate are more likely to get colds. A sample of 300 college students was asked how often they procrastinate and if they've had a cold in the last two months. Below is a two-way table of counts (rows = had a cold).
6. State the appropriate null hypotheses for this study.
A. There is no relationship in the population between Having a Cold and Procrastination
B. There is no relationship in the sample between Having a Cold and Procrastination
C. There is relationship in the population between Having a Cold and Procrastination
D. There is relationship in the sample between Having a Cold and Procrastination
7. If the p-value is 0.008 for the Chi-Square Analysis of this data, which of the following is the BEST conclusion?
A. statistically significant in the population.
B. statistically significant in the sample.
C. NOT statistically significant in the sample.
D. NOT statistically significant in the population.
8. What is the relative risk of often procrastinating between those having a cold compared to those not having a cold?
A. (50/200)/(40/100)
B. (40/100)/(50/200)
C. (50/150)/(40/60)
D. (50/90)/(40/90)
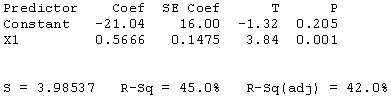
9. Using the above regression output, what is the correct regression equation?
A. y-hat = - 21.04 + 0.5666X1
B. y-hat = 0.5666 - 21.04X1
C. y-hat = 16.00 + 0.1475X1
D. y-hat = 16.00 + 0.5666X1
10. Using the above regression output, what is the correct conclusion for test of the slope?
A. Since p-value of 0.001 is less than 0.05 we reject Ho and conclude that X1 is a significant linear predictor of Y.
B. Since p-value of 0.001 is less than 0.05 we do not reject Ho and conclude that X1 is NOT a significant linear predictor of Y.
C. Since p-value of 0.205 is greater than 0.05 we reject Ho and conclude that X1 is a significant linear predictor of Y.
D. Since p-value of 0.205 is greater than 0.05 we do not reject Ho and conclude that X1 is NOT a significant linear predictor of Y.
11. Using the above regression output, then the correlation between X1 and Y would be calculated by taking:
A. The positive square root of 0.45
B. 0.45 times 0.45
C. The negative square root of 0.45
D. Either the positive OR negative square root of 0.45
12. Using the above regression output, how much of the variation in Y is explained by X1?
A. 45%
B. 42%
C. The positive square root of 0.45
D. 3.98537%
The following Minitab output is based on the responses of 35 students randomly selected from ALL sections of Stat 200 to the question "Do you smoke cigarettes?"
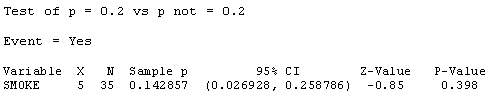
13. Based on the output above, what are the null and alternative hypotheses?
A. Ho: p = 0.2 Ha: p ≠ 0.2
B. Ho: p-hat = 0.2 Ha: p-hat ≠ 0.2
C. Ho: p = 0.2 Ha: p < 0.2
D. Ho: p-hat = 0.2 Ha: p-hat < 0.2
E. Ho: μ = 0.2 Ha: μ < 0.2
F. Ho: μ = 0.2 Ha: μ ≠ 0.2
14. Based on the output above, what statistical conclusion should you reach? The percentage of STAT 200 students who smoke:
A. does not differ from 20%
B. is less than 20%
C. is different than 20%
D. is greater than 14%
The following is the Minitab output for randomly selected responses to "What is your GPA" from a survey given to all sections of STAT 200.
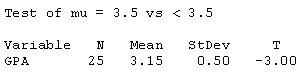
15. Based on the output above, what are the null and alternative hypotheses?
A. Ho: μ = 3.5 Ha: μ < 3.5
B. Ho: μ = 3.15 Ha: μ < 3.15
C. Ho: x-bar = 3.5 Ha: x-bar < 3.5
D. Ho: x-bar = 3.15 Ha: x-bar < 3.15
E. Ho: μ = 3.5 Ha: μ ≠ 3.5
F. Ho: μ < 3.5 Ha: μ = 3.5
16. Based on the above output what is the standard error of the mean?
A. 0.10
B. 0.50
C. 12.5
D. About 0.6
17. The primary purpose of a confidence interval is to:
A. Estimate the population parameter
B. Make decisions on differences
C. Estimate the accuracy of the sample statistic
18. From a class survey, 90% confidence intervals were created for both the females and males who responded Yes to having smoked marijuana. The 90% confidence intervals were 0.417 to 0.565 for the females and 0.437 to 0.609 for the males. What conclusions can we draw in regards to the population proportions of females and males who said that they have tried marijuana?
A. We cannot conclude there is a difference between the population proportions.
B. We cannot conclude there is a difference between the sample proportions.
C. Males are more likely than females to have tried marijuana.
D. Males are less likely than females to have tried marijuana.
19. If you were conducting a two sample T-test to compare two means, which of the following would allow you to properly use the pooled method in order to perform the test?
A. If the larger sample standard deviation was 5 and the smaller sample standard deviation was 4
B. If the larger sample mean was 5 and the smaller sample mean was 4
C. If the larger standard error was 5 and the smaller standard error was 4
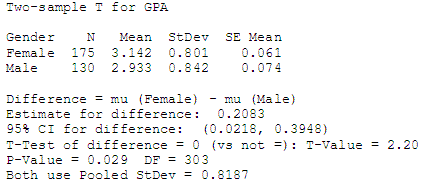
20. From the output above comparing GPA between Females and Males, was this test done using Independent or Paired methods?
A. Independent
B. Paired
21. From the output above comparing GPA between Females and Males, what decision can be made?
A. With a p-value of 0.029 we can reject the null hypothesis and conclude that there is a difference in mean GPA between Females and Males.
B. With a p-value of 0.029 we cannot reject the null hypothesis and conclude that there is a difference in mean GPA between Females and Males.
C. With a p-value of 0.029 we can reject the alternative hypothesis and conclude that there is a difference in mean GPA between Females and Males.
D. With a p-value of 0.029 we cannot reject the alternative hypothesis and conclude that there is a difference in mean GPA between Females and Males.
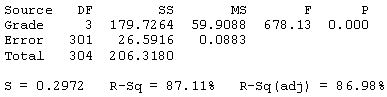
22. Based on the above ANOVA output, how many means are being tested?
A. 4
B. 3
C. 301
D. 304
23. Based on the above ANOVA output, what conclusion should be made regarding the means?
A. With p-value of 0.000 conclude that not all of the means are equal.
B. With p-value of 0.000 conclude that all of the means are different
C. With p-value of 0.000 conclude that all of the means are equal
24. Which of the following is a matched pairs design?
A. Measure levels of depression for a random sample of internet users and for a random sample of non-users.
B. Measure level of depression for a random sample on non-internet users: provide them with internet use for a year and then measure their level of depression.
25. Which of the the following techniques is best used for QUANTITATIVE data?
A. Histogram
B. Pie Chart
C. Two-way Table
D. Bar Chart
26. In general, which is more likely to contain the unknown population mean?
A. A 90% confidence interval
B. A 95% confidence interval
C. A 99% confidence interval
D. They are all equally likely
Select the most appropriate display for each of the following:
27. Rent charged and apartment size of a sample of one-bedroom apartments in State College:
A. Bar Graph
B. Histogram
C. Two-way table
D. Scatterplot
E. Side-by-Side Boxplots
Select the most appropriate statistical test for each of the following:
28. We examine a random sample of State College apartments to see if overall there is a relationship between rent charged and size:
A. Z-test about a proportion
B. t-test about a mean with a one-sided alternative
C. t-test about a mean with a two-sided alternative
D. Two-sample t-test with a one-sided alternative
E. Two-sample t-test with a two-sided alternative
F. Chi-square test
G. One-way Analysis of Variance (ANOVA)
H. Regression
29. We take random samples of African-American, White, Asian, and Hispanic workers to determine if mean earnings differ among these groups:
A. Z-test about a proportion
B. t-test about a mean with a one-sided alternative
C. t-test about a mean with a two-sided alternative
D. Two-sample t-test with a one-sided alternative
E. Two-sample t-test with a two-sided alternative
F. Chi-square test
G. One-way Analysis of Variance (ANOVA)
H. Regression
Identify whether the comparison is based on two independent samples or paired data.
30. Students are asked whether they have ever missed class as a result of drinking alcohol. Results for fraternity and sorority members are compared to results for non-Greeks.
A. Independent
B. Paired
31. Fifty students have their blood pressures before and after an exam. We wish to know if there is an increase, on average.
A. Independent
B. Paired
Select the proper NULL hypothesis.
32. Mean scores on a memory test are compared for women aged 50 to 59 years old versus women aged 60 to 69 years old.
A. H0:p1 - p2 = 0
B. H0:p-hat1 - p-hat2 = 0
C. H0:μ1 - μ2 = 0
D. H0:x-bar1 - x-bar2 = 0
33. A class survey is used to compare the GPAs of male and female students.
A. H0:p1 - p2 = 0
B. H0:p-hat1 - p-hat2 = 0
C. H0:μ1 - μ2 = 0
D. H0:x-bar1 - x-bar2 = 0
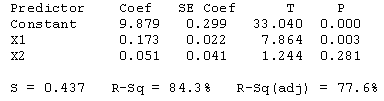
34. From the above regression output, what is the p-value and decision regarding the test of the slope for X1?
A. The p-value is 0.003 so we reject Ho and conclude that X1 is a significantly linear predictor of Y when the variable X2 is in the model.
B. The p-value is 0.003 so we do not reject Ho and conclude that X1 is not a significantly linear predictor of Y when the variable X2 is in the model.
C. The p-value is 0.003 so we reject Ho and conclude that X1 is not a significantly linear predictor of Y when the variable X2 is in the model.
D. The p-value is 0.003 so we do not reject Ho and conclude that X1 is a significantly linear predictor of Y when the variable X2 is in the model.
E. The p-value is 0.281 so we do not reject Ho and conclude that X1 is not a significantly linear predictor of Y when the variable X2 is in the model.
F. The p-value is 0.001 so we reject Ho and conclude that X1 is a significantly linear predictor of Y when the variable X2 is in the model.
G. The p-value is 0.002 so we reject Ho and conclude that X1 is a significantly linear predictor of Y when the variable X2 is in the model.
35. From the above regression output, what is the p-value and decision regarding the test of the slope for X2?
A. The p-value is 0.281 so we reject Ho and conclude that X2 is a significantly linear predictor of Y when the variable X1 is in the model.
B. The p-value is 0.281 so we do not reject Ho and conclude that X2 is not a significantly linear predictor of Y when the variable X1 is in the model.
C. The p-value is 0.281 so we reject Ho and conclude that X2 is not a significantly linear predictor of Y when the variable X1 is in the model.
D. The p-value is 0.281 so we do not reject Ho and conclude that X2 is a significantly linear predictor of Y when the variable X1 is in the model.
E. The p-value is 0.003 so we do not reject Ho and conclude that X2 is not a significantly linear predictor of Y when the variable X1 is in the model.
F. The p-value is 0.298 so we do not reject Ho and conclude that X2 is not a significantly linear predictor of Y when the variable X1 is in the model.
G. The p-value is 0.342 so we do not reject Ho and conclude that X2 is not a significantly linear predictor of Y when the variable X1 is in the model.