Reference no: EM131036641
Q1: The information reported back from an ascending radiosonde for estimation of rainfall are presented in Table 1.
a. If Y = R/100 and R% of the precipitable water is produced from the air up to an elevation of 6400 m to form rainfall at the ground level, what would be the depth of the rainfall?
b. If the temperature at ground level is 20 degree and condensation happens at 2000 meters ASL, what would be the temperature at 4000 m.
c. What are the most likely rain laden cloud types around 2000 m ASL. (More info on radiosonde: https://www.ua.nws.noaa.gov/factsheet.htm)
Table 1. Data from radiosonde
|
(a) Elevation (m)
|
0
|
400
|
800
|
1200
|
1600
|
2000
|
2400
|
2800
|
3200
|
4000
|
4800
|
5600
|
6400
|
|
Pressure (kPa)
|
100
|
98.5
|
97
|
95.5
|
94
|
92
|
90.5
|
89
|
87.5
|
83.5
|
80
|
77.5
|
75
|
|
Vapour
|
1.8
|
1.5
|
1.3
|
1.1
|
1.0
|
0.9
|
0.7
|
0.6
|
0.5
|
0.3
|
0.15
|
0.05
|
0.00
|
|
pressure (kPa)
|
+Y
|
+Y
|
+Y
|
+Y
|
+y
|
+Y
|
+Y
|
+Y
|
+y
|
+Y
|
+y
|
+Y
|
+y
|
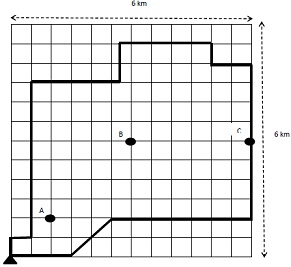
d. After the passage of a cyclone over the Northern Queensland, the rainfall stations A, B and C within an urban catchment recorded R/10 mm, 3R/20 mm and R/8 mm respectively. Estimate the mean areal precipitation over the catchment first by the arithmetic mean method and then by Thiessen polygon method. ( outlet of the catchment shown as "0° at stormwater gauging station).
Q2 On the topics of Evaporation and Transpiration
(a) In Australia, most small and medium size agricultural and livestock holdings relay on farm dams, ponds, for their water supply. Seepage and evaporation are two significant losses to be considered to be minimised if possible.
In a weather station near a farm dam, the average rainfall during the month of December is found to be R mm. A Class A pan evaporation recorded an average of [7 + (R/100)] mm/day. The average December inflow into the farm dam is (R/1000) m2/s and the average irrigation and livestock demand during the month is 40 l/s. The water level drops by R mm in that month and the average surface area of the farm dam is 3 ha. Estimate the seepage through the bed and banks of the dam during this month. Assume the pan coefficient of 0.65 for the month of December.
b) Calculate the evaporation in mm/day from a 10m by 4 m private pool with the following data was measured on that day:
Net Radiation = (100 + R) W/m2
Air Temperature = 250C
Humidity = R %
Wind run = 20 km/day measured at 2 m above the surface
Wind function f(u) for that day can be calculated as (73 + 0.44u) W/m2/kPa, when u is in km/day
Vapour pressures are in kPa and Psychrometric constant can be taken as 0.065 kP/oC What is the monthly volume of pool evaporation in m3 for January with the same average temperature?
Q3 on the Topic of Infiltration
(a) The following table shows the accumulated rainfall of a 6-hr rainfall registered by a tipping bucket rain recorder.
|
Time, hr
|
0
|
1
|
2
|
3
|
4
|
5
|
6
|
|
Rainfall.mm
|
0
|
5
|
10
|
20
|
20
|
30
|
35
|
i. Draw 1 hr time step hyetograph
ii. What is the total depth of rainfall
iii. What is the maximum intensity
iv. What is the average intensity of the storm
v. Superimpose infiltration curve as f = 2.5 + 4.5 e-0.7t on the hyetograph
vi. calculate the infiltrated volume of rainfall during the storm
vii. calculate runoff volume in m3 if rainfall occurred on a catchment of 2.5 Km2 area
viii. calculate average rate of infiltration (Φ index) for the catchment
(b) Soil infiltration characteristics (based on Horton's equation) and an observed 4-hr duration rainfall values for a 100 ha parkland catchment are given below:
fo= 10 + R/W mm/hr, fc = 0.5 + R/10 mm/hr, k=0.6 hr
| Duration |
0 - 1 hr
|
1 - 2 hr
|
2 - 3 hr
|
3 - 4 hr
|
|
Rainfall in mm
|
12.5+R/10
|
7.5 + R/10
|
10 + R/10
|
2.5 + R/10
|
i. Calculate the tota depth of infiltration
ii. What is the total volume of runoff in m3 for the observed rainfall
iii. Estimate index of the catchment
Q4 on the Topic of Unit Hydrograph Theory (convolution & use of S-curve)
Total hydrograph ordinates
|
Date
|
Hour
|
Total Flow, &is
|
|
Feb. 16
|
0600
|
11
|
|
|
0800
|
170
|
|
|
1000
|
260
|
|
|
1200
|
266
|
|
|
1400
|
226
|
|
|
1600
|
188
|
|
|
1800
|
157
|
|
|
2000
|
130
|
|
|
2200
|
108
|
|
|
2400
|
91
|
|
Feb. 17
|
0200
|
76
|
|
|
0400
|
64
|
|
|
0600
|
54
|
|
|
0800
|
46
|
|
|
1000
|
38
|
|
|
1200
|
32
|
|
|
1400
|
27
|
|
|
1600
|
24
|
|
|
1800
|
20
|
|
|
2000
|
16
|
|
|
2200
|
12
|
|
|
2400
|
11
|
At the outlet of a catchment with area of 104 Krn2, flood hydrograph and base flow ordinates resulting from 3-hr excess rainfall are presented in the following table.
i. calculate Unit Hydrograph of 3-hr for 1cm of excess rainfall
ii. calculate hourly UH
iii. Estimate surface runoff flood hydrograph if a 3-hr-storm excess rainfall temporal pattern is assumed as (2+R/10), (6+R/10) and (4+R/10) cm during each hour time step respectively.
iv. What would be the surface runoff flood peak if the total depth of rainfall excess in section (iii) is used in association with 3-hr UH from section (i).
Q5 on the Topics of Flood Frequency Analysis
(a) Assuming that the following flood data follows a Gumbel distribution, plot the data on a Gumbel probability scale (Flood magnitude vs Reduced Variate, y) and fit a linear trend to your plot. Determine the flood magnitude of ARI (return period) equal to R years from
your fitted linear trend and compare with that from the equation; (x = β + α.y)
| Year |
1994 |
1995 |
1996 |
1997 |
1998 |
1999 |
2000 |
2001 |
2002 |
2003 |
2004 |
| Peak flow |
85.5 |
240.8 |
186.8 |
160.9 |
126.6 |
140.7 |
418.7 |
16.5 |
98 |
29.2 |
100.7 |
| m3/s |
|
|
|
|
|
|
|
|
|
|
|
| Year |
2005 |
2006 |
2007 |
2008 |
2009 |
2010 |
2011 |
2012 |
2013 |
2014 |
|
| Peak flow |
18.4 |
175.4 |
314.9 |
22.2 |
262.2 |
131.7 |
13.7 |
11.7 |
3.2 |
142.8 |
|
| m3/s |
|
|
|
|
|
|
|
|
|
|
|
AEP = (m-0.4)/(N+0.2)
Y= -ln[-ln -AEP)]
α = s.√6/n
β = x--0.5772α
X = β + α.y
(b) Using frequency factor equation estimate 10 and 100 years flood magnitudes by Normal, Log-Normal, Log-Pearson and Gumbel distributions and compare the results for both above return periods.