Reference no: EM13799874
Experiment 1: The objective of this activity is to verify the relationship between net force and acceleration for each of the accelerating objects in the system as described by equations (2) and (3). For this we will use equation (4), which is the result of the combination of these two equations. We will keep the mass of the system constant (m+M) and vary the gravitational force on the hanging mass. According to equation (4), the acceleration of the system should change linearly with this force.
1. For Run # 1, arrange four 10.0 g masses on the cart so that they are evenly distributed; hang another 10.0 g mass on the S-shaped hanger. Pull the cart along the track as far as possible away from the pulley but not closer than 15 cm to the motion sensor. Press Start and release the cart. Stop the car by hand before it bangs into the magnetic stopper mount at the end of the track. Apply linear fit to the part of the data that is not in immediate proximity of the magnetic stopper. Record the slope. What physics quantity does the slope of this velocity vs time graph represent?
2. Repeat the above steps to make four additional runs. For each consecutive run, remove a 10.0 g mass from the cart then place it on the hanger. No matter how many 10.0 g masses remain on the cart always try to keep the masses on the cart symmetrically distributed. Record slopes of the graphs for each run. Remember the physics meaning of the slope of velocity vs time graph.
3. In Logger Pro plot acceleration of the system as a function of the force of gravity on the hanging mass. Apply linear fit to the acceleration vs force of gravity graph. Find the experimental value of the mass of the system along with its uncertainty by using the parameters of the regression line of acceleration vs force of gravity graph. The experimental value will be compared to the direct measurements of the mass of the system from the scale. Does your plot show any evidence of friction? How can you tell?
Experiment 2: In this experiment you will determine the acceleration due to gravity by negating the effect of friction for opposite directions of motions. The correct value of gravitational acceleration should confirm the validity of application of the Newton's Second Law. You will also use a statistical approach to the experimental data.
4. In Logger Pro set a new data table with the following new columns: "m" (kg), "slope 1" (m/s2), "slope 2" (m/s2). Notice that "m" represents the total hanging mass responsible for tension in the string (the slotted weights and the S-shaped hanger). The new calculated columns "aave" (m/s2), "g" (m/s2) should be also created: (DATA → NEW COLUMN → CALCULATED) according to equations
(9) and (10).
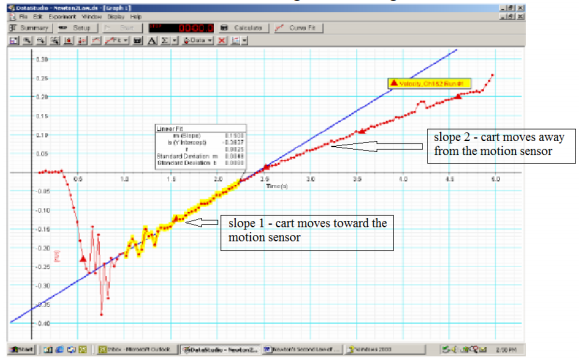
5. For 6 values of tension in the string ranging from 0.1 N to 0.4 N excluding the weight of the hanger, plot velocities vs time graph of the cart moving toward and away from the motion sensor. To put the cart in motion give it a careful push towards the motion sensor after starting the recording.

6. In Logger Pro record the value of the slope of the cart when it was moving toward to the motion sensor (slope 1) and the value of the slope when the cart was moving away from the motion sensor (slope 2).
7. Insert a new graph "g vs g" use the statistics button from the top menu bar to get a mean value of the experimental g and its standard deviation (uncertainty).