Reference no: EM13733958
1. TRUE or FALSE: ‘The output of any one purely competitive firm is so small relative to market output that it has to accept the output desired by customers in that market.' EXPLAIN and use DIGRAM to answer.
2. Use marginal and average cost and revenue curves for a perfectly competitive firm to show (DIAGRAM)
(a) a short-term loss situation;
(c) an economic profit situation;
(b) a normal profit situation
3. EXPLAIN AND DRAW DIAGRAM of the long run position of pure competitive firm?
4. ‘Competitive market economy will allocate the limited resources available to society in such a way as to maximise the satisfaction of consumers'. EXPLAIN the above statement using the concept of Productive and Allocative efficiency DIAGRAM.
LIVING CASE STUDY (EXPLAIN & DIGRAMS)
1. If Coglin Clothing is a perfectly competitive firm, explain how the firm will determine its price and profit maximising level of output.
2. Assume Coglin Clothing is faced with the following situation: market price is $10, AFC = $3, AVC= $7 and it is producing at MC=MR= 12 units. Explain whether this firm is faced with economic profit or loss. What should this firm do in the short run?
3. Assume that Coglin Clothing, a perfectly competitive firm, is currently operating at normal profit situation. Discuss the likely impact on this firm in the short run if there is now a decrease in the demand for its product. What will happen in the long run?
Please EXPLAIN including DIAGRAMS to answer to the following TRUE or FALSE questions.
1. Variable costs have no impact on marginal costs in short run.
2. Marginal product is the change in revenue associated with the selling of one more unit of output.
3. Purely competitive firms have to accept both the output and price from the market.
4. For a firm in pure competition, the profit maximisation rule is either MR=MC or P=MC or AR=MC.
5. For individual firm under pure competition, zero economic profit happens when price equals average variable cost.
6. A competitive firm faced with a price that is below its average total cost will minimize its losses by continuing to operate.

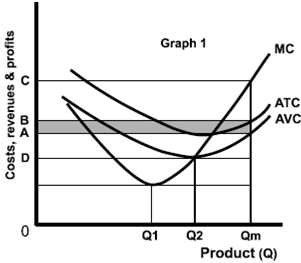
7. In Graph 1 assume that the market price is 0D. A firm producing an output of 0Qm would make a loss equal to its fixed costs.
8. In Graph 1, if we assume that 0Qm is the profit maximising level of output, then MR equals 0C.
9. The short run supply curve for a firm that has the cost curves as in Graph 1 is the rising part of MC above average total cost.
10. A firm with a market price lower than 0D will minimize losses by producing zero rather than 0Q2.