Reference no: EM131195995
Answer the following questions using the cost curves for the price-taking firm shown in the figure below.
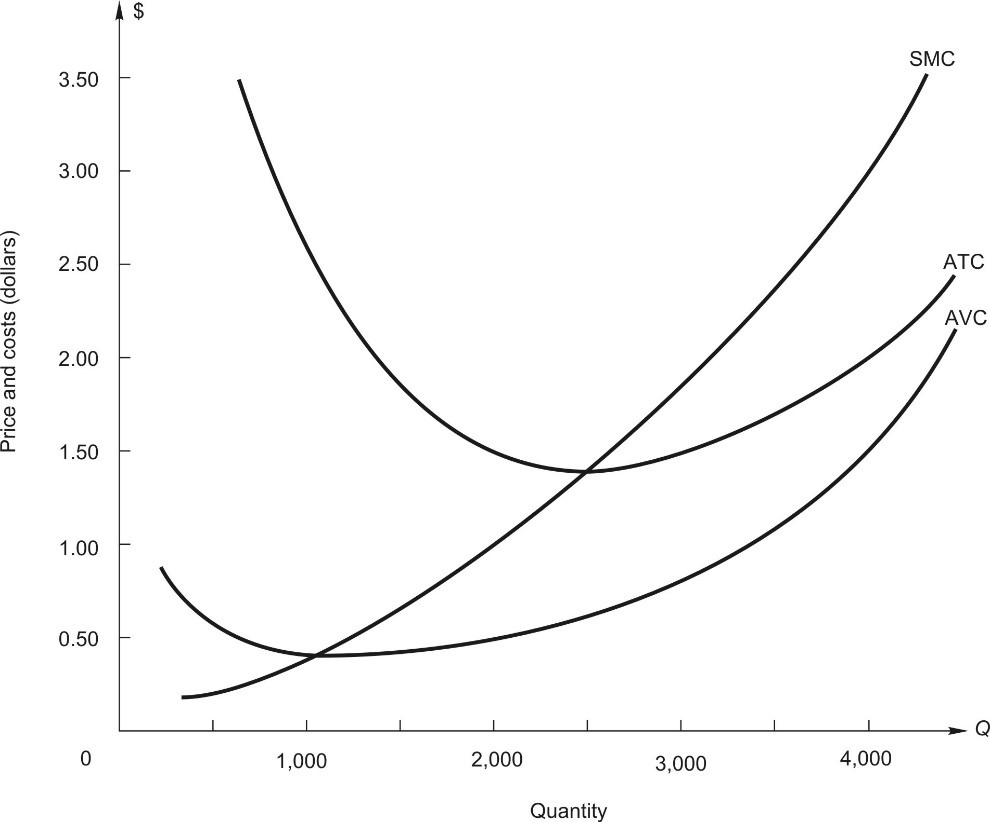
If price is $3 per unit of output, draw the marginal revenue curve. The manager should produce _____________ units.
Since average total cost is $________ for this output, total cost is $___________.
The firm makes a profit of $_____________.
Let price fall to $1, and draw the new marginal revenue curve. The manager should now produce ________ units.
At a price of $1, total revenue is now $_____________ and total cost is $____________. The firm makes a loss of $_____________.
At a price of $1, total variable cost is $_____________, leaving $_____________ to apply to fixed cost.
If price falls below $_____________, the firm will produce zero output.
|
Calculate your opportunity costs of standing in line
: You are standing in line. Think about what you would be doing if you are not in this line. The alternatives are infinite and computing the cost of them all is impossible. However, since you could only be doing one thing (not all of them) if you are n..
|
|
What is the optimal defection from the collusive agreement
: An industry consists of two ?rms. The demand function for the product of ?rm i is qi =24−5pi +2pj. The marginal cost of production for each ?rm is zero. Find the price best-response function for ?rm i. What are collusive pro?ts? Bertrand pro?ts? What..
|
|
View deadweight loss that arises if you set monopoly price
: A monopolist produces a product which has high investment cost. The marginal cost of the product is very small ( negligible ). The monopolist has a patent for the product. Show in a chart the price of goods that would arise if the company is unregula..
|
|
Suppose monopolist faces the demand and cost curves
: Suppose a monopolist faces the demand and cost curves shown in the figure below. The monopolist maximizes profit (minimizes loss) by producing __________ units of output. The monopolist will sell its output at a price of $__________ per unit.
|
|
Using the cost curves for the price-taking firm
: Answer the following questions using the cost curves for the price-taking firm shown in the figure below. If price is $3 per unit of output, draw the marginal revenue curve. The manager should produce _____________ units.
|
|
The manager of competitive firm
: The manager of a competitive firm will:
|
|
Discuss the opportunity costs of natural disasters
: You are standing in line. Think about what you would be doing if you are not in this line. The alternatives are infinite and computing the cost of them all is impossible. Discuss the opportunity costs of natural disasters. Calculate (in $$$) your opp..
|
|
Draw the consumer budget constraint on the plane
: Suppose, as in the federal income tax code for the United States, that the representative consumer faces a wage income tax with a standard deduction. Draw the consumer's budget constraint on the (l,C) plane.
|
|
Think of free offers used by online retailers or marketer
: Based on these articles and other readings you may find, what do you think of the “free” offers used by online retailers or marketer? Do you think the “free” offers would be more effective than coupons? Use some concepts you learned from module 5, as..
|