Understand and comment on possible forecast errors

Assignment Help Basic Statistics
Reference no: EM13850461

Singapore's Tourist Arrival

A bridge between the East and the West for centuries, Singapore embraces tradition and modernity. Colourful ethnic precincts amongst efficient business centres, and serene gardens set against sleek skyscrapers, Singapore is a fascinating destination for leisure and business travellers (MTI, 2015).

Over the years, there has been remarkable transformation in Singapore's tourism landscape and there are various reported record growth in both tourism receipts and visitor arrivals. Since 2004, Singapore has grown her tourism receipts by almost 2.5 times while visitor arrivals also almost doubled (MTI, 2015).

A common key performance indicator is the International Visitor Arrivals which refer to travellers taking a trip to Singapore whose length of stay is less than a year. This excludes:

• All Malaysian citizens arriving by land;

• Returning Singapore citizens, permanent residents and pass holders

• Non-resident air and sea crew (except for sea crew flying in to join a ship); and

• Air transit and transfer passengers.

Arrival statistics are reported by country of residence based on information from Disembarkation/Embarkation (D/E) Cards by the Immigration and Checkpoints Authority of Singapore (STB, 2015).

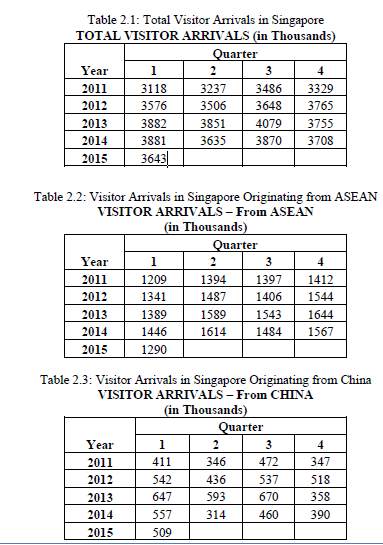
Using the data in Tables 2.1, 2.2 and 2.3 below, produce forecasts of the Visitor Arrivals in Singapore (Total, ASEAN and China) and prepare a report according to the requirements listed.

1912_KI.png

Question

(a) Provide an understanding and background discussion on the methodology of forecasting.

(b) Determine the seasonality of the data by conducting an in-depth seasonality analysis for Table 1, 2 and 3. For each quarter, indicate the seasonal indexes, the depersonalised time series and the trend line that will fit the depersonalised time series. Adjust the seasonal indexes, if necessary. Provide justification on the appropriateness of seasonality analysis.

(c) Understand and comment on possible forecast errors and the cause of these errors.

(d) Develop an overall conclusion of your forecasting findings, policy observations and recommendations.

Reference no: EM13850461

Questions Cloud

Weights for the weighted average cost of capital : The comptroller currently finds the weights for the weighted average cost of capital (WACC) from information from the balance sheet shown in Table 2. Compute the book value weights that the comptroller currently uses for the company's capital stru..
Write reflection paper discussing your scores on the scales : Write a short paper 3-5 page reflection paper discussing your scores on the scales and what you learned about yourself. Explain how this behavior can hinder you in the future if not mitigated now; how might this behavior effect your organization; ..
Design a marketing plan for 3m australia : Marketing mix strategy by looking at the various marketing theories taught this term. The challenge is to think outside the box and create a plan that is feasible for the brand - Marketing Plan for a company - the specific case study.
Understand and comment on possible forecast errors : Provide an understanding and background discussion on the methodology of forecasting.
What is the future value of inheritance at retirement : You believe you will need to have saved $500,000 by the time you retire in 40 years in order to live comfortably. You also believe that you will inherit $100,000 in 10 years. If the interest rate is 6% per year, what is the future value of your inher..
Explain specific and aggregate stop loss : What does it mean to self-insure the WC coverage? Explain Specific and Aggregate Stop Loss.
Paper on a community health assessment for program planning : Develop an 8-10 page paper on a community health assessment for Program planning, including the benefits of incorporating components of various Approaches to conducting a needs assessment
About the annual inflation rate : Assume a country has an official inflation rate of 130% per month. What was the annual inflation rate?

Reviews

Write a Review

Basic Statistics Questions & Answers

  Of the controls 3 had previously experienced meningitis set

spasmodic dysphonia sd is an idiopathic chronic and disabling voice disorder. in a case-control study 150 cases of sd

  Determine sample size-standard iq points

A standard IQ test has mean of 98 and a standard deviation of 16. We want to be 99% certain that we are 8 IQ points of the true mean. Determine the sample size.

  Cynthia has ordered 3 identical computers for the office

cynthia has ordered 3 identical computers for the office. the probability this make and model of computer crashes

  Assume each repetition is independent of the others what is

q1. consider an experiment that results in a positive outcome with probability 0.38 and a negative outcome with

  Probability that consumer purchased few products

Given that consumer changed te brands, what is the probability that consumer purchased fewer products than before?

  Modeled using the binomial distribution

Preliminary results indicate that once a golfer has checked in, there is only at 20% chance that he or she will be a no-show. This chance of being a no-show can be modeled using the binomial distribution.

  Determine the standard deviation and sample mean

They tested a random sample of 40 batteries using a special device designed to imitate real-world use and recorded data on battery lifetime. Determine the sample mean (in minutes).

  Suppose the coach of the football team wants to estimate

suppose the coach of the football team wants to estimate the proportion of the population of fans who support his

  What is the sensitivity and specificity of the test

Using a test, 80% of Down's Sydrome cases can be identified, while 5% of normals are detected as positive. What is the sensitivity and specificity of the test?

  Evaluate the t statistic for testing contrast

The ANOVA table is given below,as well as a table of means and standard deviations for the three groups. Evaluate the t statistic for testing contrast

  Find the confidence interval of the true proportion

Find the confidence interval of the true proportion of students to receive a 3.0 GPA. Find the Z score, standard error, range, and your conclusion in a sentence.

  How normal model used to represent sampling distribution

the professor plots a histogram of these several proportions. Should a Normal model be used to represent the sampling distribution of the proportion of tails?

Free Assignment Quote

Assured A++ Grade

Get guaranteed satisfaction & time on delivery in every assignment order you paid with us! We ensure premium quality solution document along with free turntin report!

All rights reserved! Copyrights ©2019-2020 ExpertsMind IT Educational Pvt Ltd