Reference no: EM13372323
The oil market
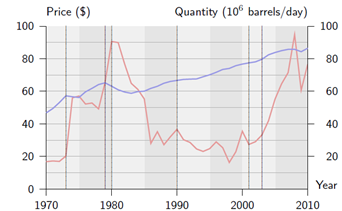
The world oil market has been through tremendous changes in the past decades, resulting in significant variations in price and output (cf Exhibit 1). Why have oil prices been so much more volatile than most other goods?
The birth of OPEC
Prior to 1970, world oil prices were set through negotiations among major private sector companies, including Standard Oil of New Jersey (Exxon), Standard Oil of California, the Texas Company, and Royal Dutch Shell. In the early 1970s, however, supply and pricing power were gradually transferred from private companies to the governments of major oil producing countries.
The Organization of Petroleum Exporting Countries (OPEC) was born in 1960 with member countries Iran, Iraq, Kuwait, Saudi Arabia, and Venezuela. Qatar, Indonesia, Libya, the United Arab Emirates, and Algeria joined in the ensuing decade. In October of 1970, Libya became the first OPEC member to independently increase its posted price and tax rate on oil produced by private companies. Iran and Kuwait followed in November of the same year. By December, OPEC countries had all established a minimum 55% oil tax rate for private oil companies. In January 1971, six OPEC governments and twenty-two major oil companies gathered in Teheran. The oil companies agreed to accept the 55% oil production tax, which led to an immediate increase in world prices. Meanwhile, during the 1971{1974 period, Algeria, Libya, Iraq, and Kuwait nationalized the majority of western-owned oil assets.
The Yom Kippur war and the first oil shock
The Yom Kippur War of October 1973 triggered the first major oil shock. In November 1973, OPEC countries announced a 25% cut in production. Moreover, they agreed on an oil embargo to the United States, the Netherlands, Portugal, Rhodesia, and South Africa. Crude prices increased sharply from $5.12 to $11.65 a barrel.
Iran, Iraq, and the second oil shock
Political developments from 1978 to 1980 led to a second drop in oil supply, which in turn led to above $30 prices. In 1978, Iranian students increased their protests against thegovernment of Shah Reza Pahlavi. The climate of political unrest led to the departure of foreign oil production workers, and as a result Iranian oil production dropped from 1.5 million to 500 thousand barrels/day. In January 1979, the government was forced to resign and Ayatollah Khomeini was declared the country's new leader. In November 1979, a group of Iranians took over the American embassy in Tehran, holding its inhabitants as hostages. As a result, all ties between Iran and U.S. oil companies were severed.
Meanwhile, Saudi Arabia announced a significant cut in oil production (to 9.5 million barrels/day), thus leading to additional shortages in oil production. By the end of 1979, the oil price had reached $24/barrel.
Oil-related turmoil continued in 1980. In September, war between Iraq and Iran erupted over the Shatt al Arab waterway. The conflict led to the bombing and destruction of several oil production facilities in both countries. By the end of 1980, the world price of crude reached $32/barrel.
Exhibit 1
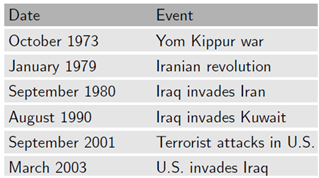
Oil price (Brent spot) and demand. Vertical lines correspond to events listed on Table 1.
The 1980s
By the mid 1980s, the oil price had fallen to $11/barrel. Since inflation had increased prices by at least a factor of two since 1973, this effectively returned oil prices to their pre-1973 levels. Analysts cited the increased use of alternative energy resources and greater effortsat conservation.
The invasion of Kuwait
In August 1990, Iraqi troops occupied Kuwait. The invasion led to a decline in oil production by 4 million barrels/day (due primarily to the destruction of oil facilities in Kuwait). Crude oil prices surged to $32/barrel. Coinciding with the start of the allied military action against Iraq (January of 1991), the U.S. initiated a direct withdrawal of 33.75 million barrels from the country's Strategic Petroleum Reserve, which partly compensated for the decline in production.
Table 1
Selected events affecting the oil market
By March of 1991, the surplus of unsold oil held by oil producers exceeded 80 millionbarrels. As a result, OPEC countries announced a reduction in output to 22.3 million barrels/day. Kuwait resumed oil production in January 1992, supplying 400 thousand barrels/day. An oil embargo was imposed on Iraq's oil exports.
The end of the 20th Century
The last years of the 20th Century witnessed a wide range of political, economic and environmental events relevant to the world oil market. In 1998, several Asian economiesplunged into deep financial crisis. In the same year, the United Nations approved a resolution allowing Iraq to increase oil exports as part of the humanitarian oil-for-food program.This increased Iraq's export capacity from 1.6 to 1.9 million barrels/day. Other OPECcountries, however, reduced their production (by 1.245 million barrels/day in March andby an additional 1.355 million barrels/day in June). Significant non-OPEC oil producers,including Russia, Oman, and Mexico agreed to cut production too (by a total of 0.5 millionbarrels/day). These reductions continued into 1999.
The beginning of the 21th Century
The second half of the 1990s marked a period of rapid expansion by the U.S. economy, resulting in a significant increase in consumption of oil and other energy sources. Thetechnology bust of 2000 and the recession following the tragic events of September 11, 2001,
brought about a decrease in economic activity. OPEC members, followed by Russia, Norway and Mexico, agreed to significant output reductions.Meanwhile, China, India and other Asian economies started a period of unprecedented economic growth.
Questions
(a) Explain how each of the events described above, including the ones listed in Table 1,affected the world market for oil. Specifically, use a supply and demand diagram to explain changes in price and output.
(b) Based on your knowledge of current events, what can you say about the recent evolution of the oil market (since the period covered by the case).
(c) Exhibit 1 suggests that oil price is more volatile than output. Why? Can you think of other markets with a similar pattern, as well as markets where the opposite pattern holds?