Reference no: EM138192
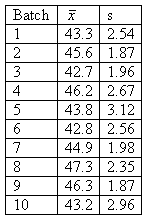
1. We are establishing a quality control program for a process and need to establish the mean and standard deviation for the process. The first 10 batches had samples of size 5 taken, and the following data were recorded.

Based on this information, where should the centerline for the chart be?
A. 44.35
B. 44.61
C. 45
2. We are establishing a quality control program for a process and need to establish the mean and standard deviation for the process. The first 10 batches had samples of size 5 taken, and the following data were recorded.

Based on this information, where should the centerline for the s chart be?
A. 2.339
B. 2.488
C. 2.646
3. We are establishing a quality control program for a process and need to establish the mean and standard deviation for the process. The first 10 batches had samples of size 5 taken, and the following data were recorded.

Based on this information, what are the control limits for ?
A. 41.27 to 47.95
B. 41.06 to 48.16
C. 42.08 to 47.96